Monitoring an archaeological excavation using photogrammetry and digital elevation models (DEMS): the case study of Barranco León in Orce (Granada, Spain)
Monitorización de una excavación arqueológica usando fotogrametría y modelos digitales del terreno (MDT). EL CASO DE ESTUDIO DE BARRANCO LEÓN, ORCE (GRANADA, ESPAÑA)
Juan José González-Quiñones
Department of Sciences, La Inmaculada Teacher Training Centre.
Department of Architectural and Engineering Graphic Expression, University of Granada ETSICCP, Campus de Fuente Nueva, C/ Severo Ochoa s/n. 18071 Granada, Spain.
Stipendiary Lecturer in Archaeology and Anthropology, St. Hugh’s College, Oxford, UK. Postdoctoral Researcher, Emmanuel College, University of Cambridge, UK.
Abstract In this paper, we describe and discuss emergent digital technologies employed for monitoring the excavations at the archaeological site of Barranco León (Granada, Spain) between 2017 and 2020. The method entails the following material requirements: a total station, a conventional camera, a computer and a software that integrates photogrammetry algorithms; in terms of human resources, the presence of an engineer for the first day of the excavation to set up the methodological process and trained excavation staff to perform said method on a daily basis is necessary. Here we present the daily workflow for monitoring archaeological excavations introduced at the site, followed by an estimation of the costs and a summary of the results obtained. The method introduced here is based on the height difference of Digital Elevation Models (DEMs) computed on successive days using photogrammetric techniques. It is a non-invasive method, which requires less than 8% of the economic resources of the excavation and can be carried out in less than 15 minutes. This allows the excavation director to have an accurate and visual idea of the excavation process in order to make appropriate decisions. In addition, from the results obtained in the method (differences in DEM of every two days), other derived results can be obtained such as the exact location of the archaeological remains extracted based on their size. These features highlight the relevance and applicability of this approach to a wide range of archaeological sites.
Keywords Digital archaeology, Documentation, Excavation monitoring, Photogrammetry, Digital Elevation Model, DEM, Orce.
Resumen En este artículo, describimos y discutimos las tecnologías digitales emergentes utilizadas para la monitorización de las excavaciones del yacimiento arqueológico de Barranco León (Granada, España) entre las campañas de 2017 y 2020. El método implica el uso de los siguientes recursos materiales: una estación total, una cámara de fotos convencional, un ordenador y un programa que integre algoritmos de fotogrametría; referente a los recursos humanos, es necesaria la presencia de un ingeniero durante el primer día de la excavación para establecer el proceso metodológico y un excavador entrenado para llevar a cabo dicho método diariamente. Aquí, presentamos un flujo de trabajo diario para la monitorización de la excavación de un yacimiento arqueológico, seguido de una estimación de los costos y un resumen de los resultados obtenidos. El método presentado se basa en la diferencia de altura de los modelos digitales del terreno (MDT) calculados en sucesivos días utilizando técnicas fotogramétricas. Es un método no invasivo, que requiere menos del 8% del coste total de la excavación y se puede llevar a cabo en menos de 15 minutos. Esto permite que el director de la excavación tenga una visión precisa y una idea visual del proceso de excavación para tomar las decisiones adecuadas. Además, a partir de los resultados obtenidos en el método (diferencias en MDT de cada dos días), se pueden obtener otros resultados derivados como la ubicación exacta de los restos arqueológicos extraídos en función de su tamaño.
Palabras clave Arqueología digital, documentación, monitorización de una excavación, fotogrametría, Modelo Digital del Terreno, MDT, Orce.
Fecha recepción: 05/05/2022 Fecha aceptación: 29/07/2022
González-Quiñones, J. J., Reinoso-Gordo, J. F., Solano-García, J. A., Cámara-Donoso, J. M., León-Robles, C. A., Linares-Matás, G. y Jiménez-Arenas, J. M.(2022): “Monitoring an archaeological excavation using photogrammetry and digital elevation models (DEMS): the case study of Barranco León in Orce (Granada, Spain)”, Spal, 31.2, pp. 10-30. https://dx.doi.org/10.12795/spal.2022.i31.18
Archaeological excavations have traditionally been monitored daily through the use of notes on drawings or sketches (Baird, 2014; Carrocera Fernández et al., 2007; Gaulton et al., 2015; Steen-McIntyre et al., 1981). Using current technology and photogrammetric algorithms, it becomes possible to document and monitor an archaeological excavation in a smoother and more accurate way through the periodic generation of 3D point clouds (Callieri et al., 2011; Gaulton et al., 2015; Martínez-Fernández et al., 2020; Rinaudo et al., 2012). In the present case study, the monitoring was managed by creating three-dimensional real scenarios at the beginning and end of each campaign conducted by our team at Barranco León (Orce, Granada, Spain) between 2017 and 2020 (Reinoso-Gordo et al., 2020).
The generation of three-dimensional real scenarios is being applied to several fields of science. In the field of psychology, it is possible to recreate realistic scenarios to train patients to deal with their own reality (Bohil et al., 2011; Parsons et al., 2017; Parsons and Rizzo, 2008). In the field of clinical medicine, it facilitates data visualization and diagnostic tests (Bruckheimer et al., 2016; Fisher, 2013). In the fields of architecture and engineering, it is possible to obtain the current state of any facade (Dhonju et al., 2017) any road (González-Quiñones et al., 2018), any bridge (León-Robles et al., 2019) or any dam (Sancho Gómez-Zurdo et al., 2021) with the necessary accuracy for its maintenance and conservation through aerial photogrammetry using drones or terrestrial laser scanners. In palaeontology and archaeology it is also being applied, for example, in order to map Pleistocene sites and to classify fossil-bearing surfaces (Armstrong et al., 2018). In archaeological prospection, it is been used to document fossils (Armstrong et al., 2018), to document archaeological excavation (De Reu et al., 2014; Masson-MacLean et al., 2021; Peng et al., 2017; Wessling et al., 2014), to make topographic analyses (Hoffmeister et al., 2016), to analyse the tracing of engravings (Gil-Docampo et al., 2020), to represent underwater archaeological data (Repola et al., 2018), and to document rock paintings (Wang et al., 2019). With regard to the tree-dimensional technological solutions applied to archaeological sites in Spain, we can highlight the study of the Panoria megalithic necropolis in Granada (López et al., 2016), the virtual reconstruction of the archaeological site of Castellet de Bernabé in Llíria, (Portalésa et al., 2017), the virtual reconstruction and analysis of fieldwork at Cocina Cave in Dos Aguas, Valencia, (Castillo et al., 2017), the drone-led characterization of a Mozarabic church in Bobastro, Málaga (Enríquez et al., 2020), the pseudo-3D reconstruction using Ground Penetrating Radar of a complex Roman site in Lugo (Novo et al., 2010), the 3D monitoring of Paleolithic archaeological excavations using terrestrial laser scanner at Atapuerca, Burgos (Martínez-Fernández et al., 2020), the digital documentation in the Roman villa of Salar, Granada, (Henestrosa et al., 2022), and the use of Virtual Reality in the archaeological site of Fuente Nueva 3, Orce, Granada (Reinoso-Gordo et al., 2020). Nonetheless, no publication has performed the kind of daily excavation monitoring throughout a complete field season or assessed the cost of monitoring an archaeological excavation using 3D technology presented here.
Our research focuses on the affordances of digital photogrammetry. Digital photogrammetry is based on the knowledge of the projectivity of a series of overlapping photographs to establish the three-dimensional coordinates of a real scene (Mikhail et al., 2001). Two main dimensions of digital photogrammetry are currently being applied to archaeology: 1) the Multiple View in Geometry and structure from motion approach Hartley and Zisserman (2000) and 2) the Scale-Invariant Feature Transform (SIFT) algorithm developed by Lowe (2004). Multiple View approaches the problem of relative orientation from the field of projective geometry. The concept of an outlier is used to subsequently eliminate such points using Random Sample Consensus (RANSAC) techniques (Fischler and Bolles, 1981; Hast et al., 2013; Hollander et al., 2007), and the calculation of matrices with a large number of rows (number of homologous points) is accelerated using “sparse matrix” techniques (Lourakis and Argyros, 2009). The SIFT algorithm (Lowe, 2004), on the other hand, makes it possible to automatically identify homologous points in the overlapping areas of photographs (areas common to both photographs) with a formerly unattained hit rate. Regarding the digital photogrammetry process, four main phases can be discerned (fig. 1): 1) Homologous point identification (Gaulton et al., 2015; Leutenegger et al., 2011; Lowe, 2004; Obdržálek et al., 2010; Rublee et al., 2011). 2) Relative orientation by pairs of photos. In this phase the fundamental matrix, called F, is calculated (Elnima, 2015; Heipke, 1997; Snavely et al., 2008). 3) Structure from Motion (SfM). This optimisation problem is known as bundle adjustment (Brown, 1976; Granshaw, 1980; Triggs et al., 2000). 4) Absolute orientation or georeferencing. This is carried out with a simple affine transformation or similarity, which takes the coordinates established in the SfM phase (phase iii) to ground coordinates (usually a geodetic system).
Based on the generation of three-dimensional scenarios, it is possible to derive from them elements such as DEM (Digital Elevation Model), solid 3D models, pieces to print, etc. DEMs have been widely used in engineering and architecture, notably the drawings of topographic profiles, modelling of runoff flows, studies of slope slides, and the building of physical models (Costa-Cabral and Burges, 1994; Goodale et al., 1998; Hsieh et al., 2016; Reinoso, 2010; Zhang and Montgomery, 1994). The gridded-model DEM (Maune, 2007), employed in the present research, is currently the most widely used model. They serve as a regular rectangular matrix, with each subdivision storing an elevation value, enabling a high accuracy (Mesa-Mingorance and Ariza-López, 2020).
As such, we argue that it is possible to mobilise current techniques for the efficient monitoring of archaeological excavations. We demonstrate this potential through the results obtained in the digital documentation of excavations at Barranco León (BL) site, Spain, in the context of the BC.03.03/17 project funded by the regional government (Junta de Andalucía, Consejería de Cultura) between 2017 and 2020.
1.1. The Barranco León (BL) site at the Archaeological Zone ‘Orce Basin’ ^
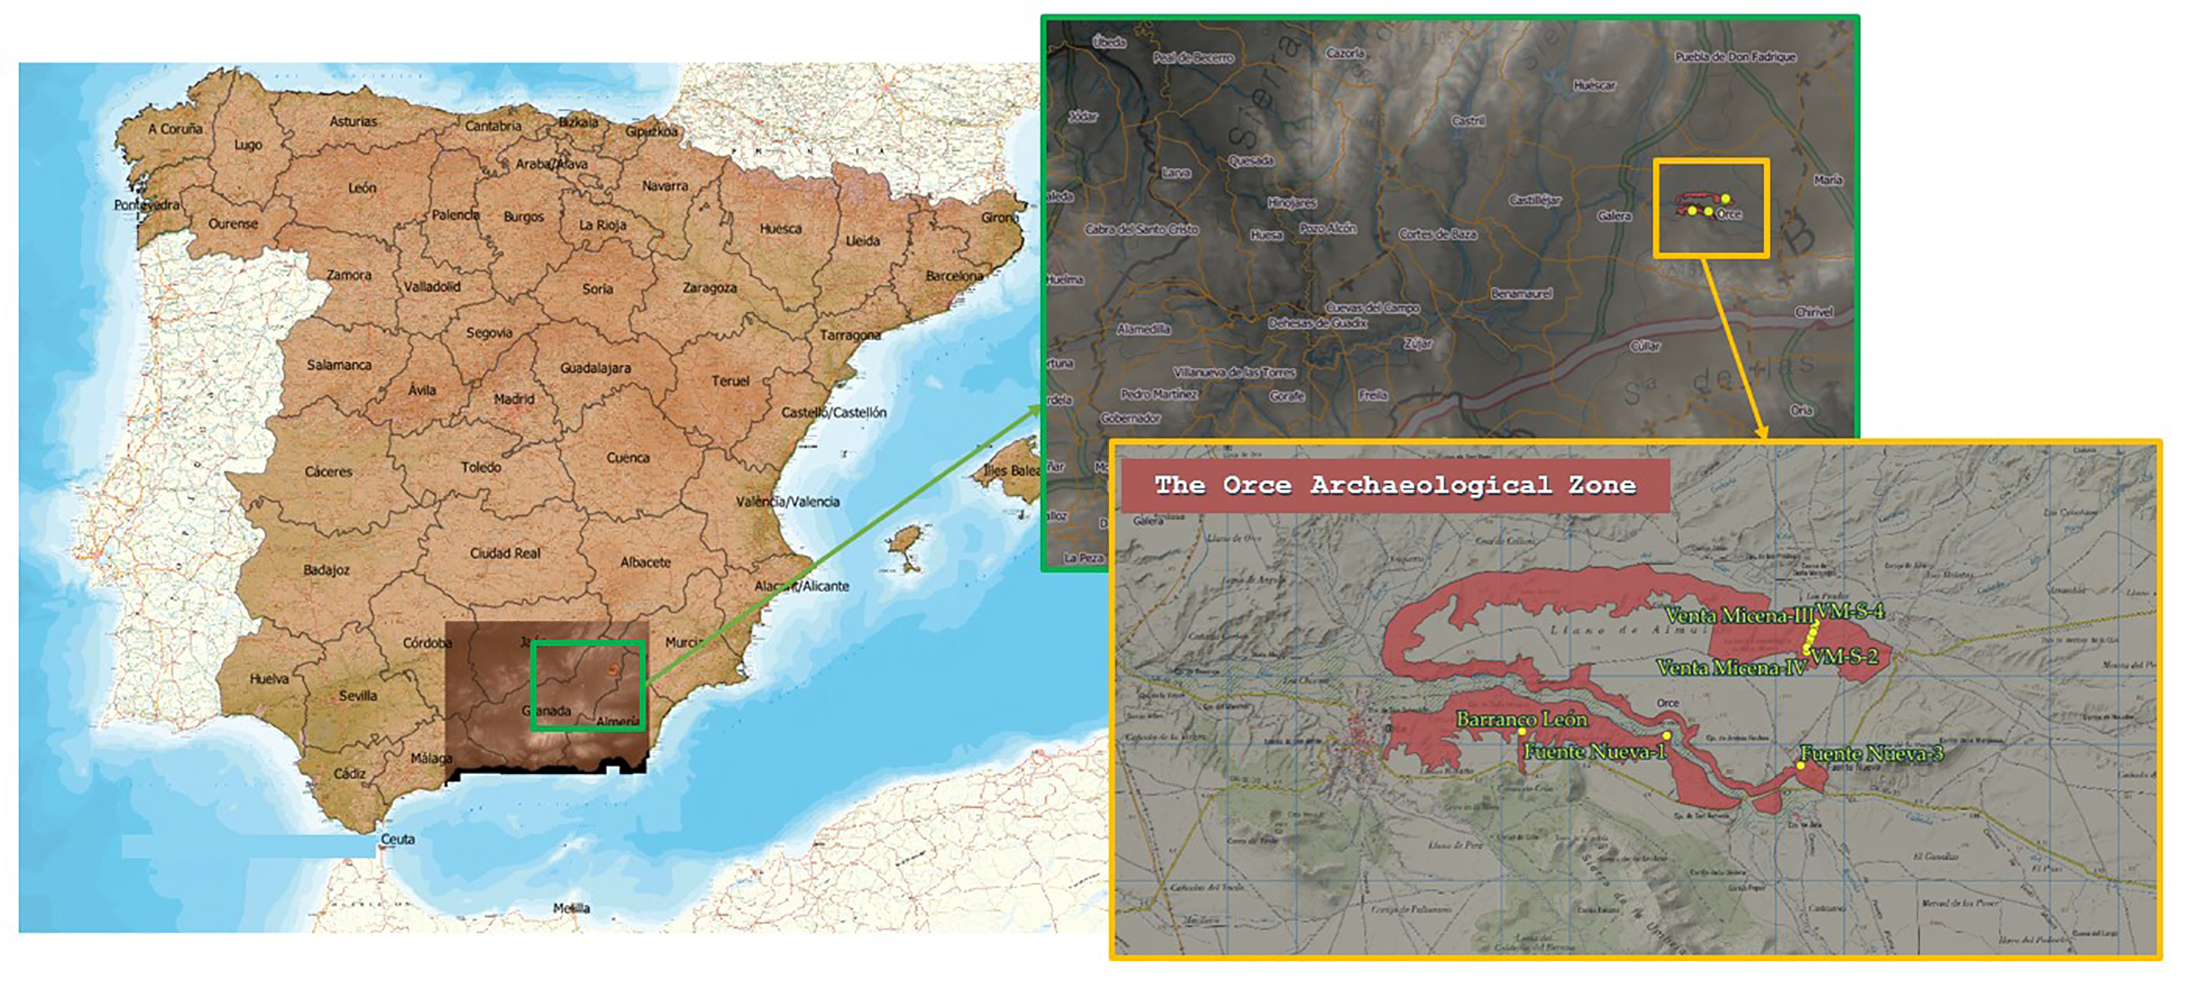
The present study focuses on the BL site (fig. 2), which is part of the ‘Orce Basin Archaeological Zone’ (OBAZ), located in the most north-easterly part of the Guadix-Baza Basin (GBB) (Granada province, southern Spain). The OBAZ covers an area of 5,784.396 m2 and includes some of the most prominent archaeo-palaeontological sites for the understanding of the first human settlement in Western Eurasia (Maldonado-Garrido et al., 2020), notably BL (Anadón et al., 2015; Titton et al., 2020, 2021; Toro-Moyano et al., 2013; Yravedra et al., 2022).
Figure 2. Archaeological Zone ‘Orce Basin’ (OBAZ), Granada, Spain. ^
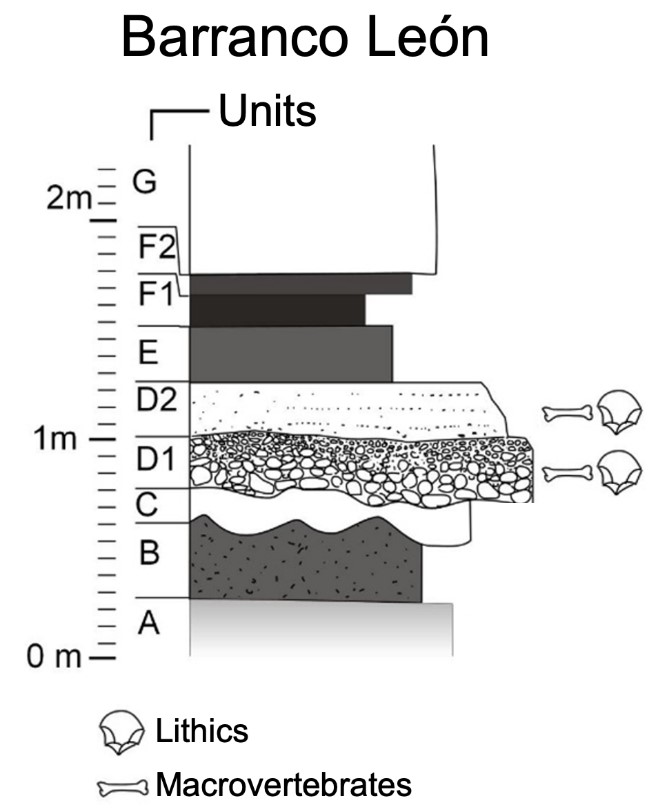
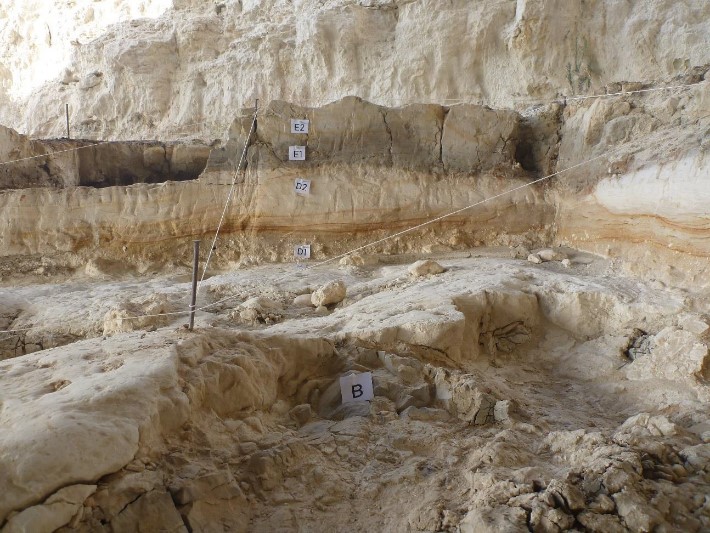
The fieldwork at BL began in 1995 (Gibert et al., 1998) and has continued steadily to the present, notwithstanding a temporary interruption between 2006-2010. The site has 9 distinct stratigraphical levels (Oms et al., 2011) (fig. 3): level A, beige calcsiltites to calcarenites; level B, black and dark green feldspar quartz muddy sands; level C, beige calcsiltites to calcarenites; level D1, greyish gravels with a sandy matrix; level D2, greyish quartz-bioclastic sands, ending in whitish limestones; level E, fine-to-medium-grained quartz and feldspar sands, with reddish, brown and greenish colorations; level F1, black sandy mudstones; level F2, bioclastic sands of greyish quartz with small chalk nodules in the upper part; and level G which corresponds to beige-coloured sands.
Figure 3. Stratigraphic succession at the Barranco León site: a) Stratigraphy scheme. b) Stratigraphy photography. ^
D1 and D2 levels are the richest in archaeological and paleontological content with more than 32,000 records generated to date. These levels have outstanding elements such as the Homo sp. deciduous lower molar found in 2003 (Toro-Moyano et al., 2013) at the D1 level; based on a combination of ESR (Toro-Moyano et al., 2013), magnetostratigraphy (Oms et al., 2000) and biochronology (Agustí et al., 2015; Martínez-Navarro et al., 2015), which date level D1 to 1.46 Ma, the Orce milk tooth may be the oldest human remain in western Eurasia. Also, these two levels contain a type of knapped lithic industry called subspheroids (Titton et al., 2020), which pertain to the Developed Oldowan or Acheulean lithic assemblages. The dating of the BL subspheroids to c. 1.4 Ma makes these the oldest record of this type in Europe.
At present, 148 m2 of the BL study site have been excavated. The present research project centres on D1 and D2 l, in the southern sector of the site, an area containing an abundance of archaeo-palaeontological material. Excavation follows natural layers and all elements larger than 20 mm and smaller than 20 mm that are identifiable have been coordinated (x, y, z, orientation and slope). During the excavation campaigns from 2017 to 2020, a total of 51 of 1 m2 each one were excavated 17 m2, 15 m2, 13 m2 and 6m2 respectively.
In terms of palaeontology, BL is distinguished by the presence of a typical Epivillafranquian large mammal assemblage (e.g., Martínez-Navarro et al., 2010; Toro-Moyano et al., 2013). In addition, a diverse group of microvertebrates (rodents, insectivores, amphibians and reptiles) is also represented (e.g. Agustí et al., 2015; Blain et al., 2016; Sánchez-Bandera et al., 2020).
The OBAZ excavations by the current Orce Research Project took place between 2017 and 2020. Four excavation campaigns were completed at BL; one campaign per year.
Understanding the requirements of monitoring an excavation demands knowing the human resources available and the monitoring method employed. Regarding human resources, in each excavation campaign a director, technical support, and a changing number of excavation staff worked together, depending on the campaign. Depending on the campaign, freehand sketches and photogrammetry were used for daily monitoring, while photogrammetry was the main global monitoring method used in every campaign (fig. 4). Table 1 provides specific information concerning the excavation campaigns.
Figure 4. Photogrammetric survey of the excavation of the BL site in 2017. ^
Table 1. Data from each excavation campaign.
Start date
End date
Excavation staff [number]
Daily
monitoring
Monitoring
of the
entire campaign
Excavation campaign of 2017
July 3rd 2017
July 22nd 2017
12
Freehand sketches
Photogrammetry,
3D model
Excavation campaign of 2018
July 9th 2018
July 28th 2018
14
Freehand sketches
Photogrammetry,
3D model
Excavation campaign of 2019
July 3rd 2019
July 22nd 2019
10
Freehand sketches
Photogrammetry,
3D model
Excavation campaign of 2020
July 24th 2020
July 31st 2020
6
Photogrammetry,
3D model
Photogrammetry,
3D model
The monitoring method for the excavation of an archaeological site (Section 2.1.) and the analysis of time, materials, and human costs required for the fourth excavation campaign are provided below (Section 2.2).
2.1. Monitoring an archaeological excavation during the pandemic period ^
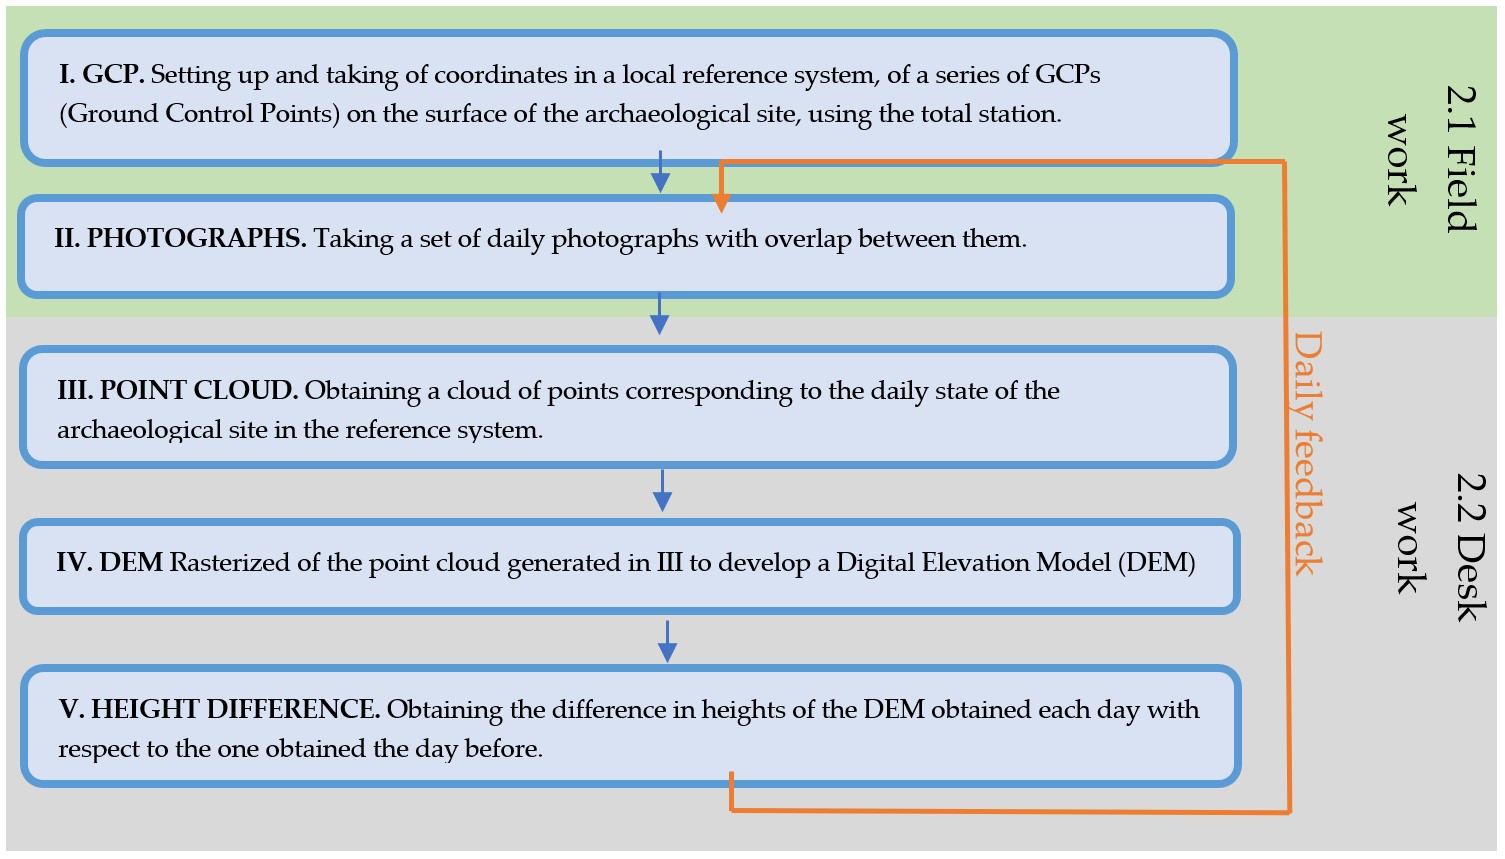
The method for monitoring the excavation of the sites mentioned in this research was based on the determination of height differences between Digital Elevation Models (DEM) generated on successive days using photogrammetric techniques. The workflow consists on 5 phases, as shown in figure 5.
During fieldwork, documentation took the form of accurate photogrammetric surveys. The instruments used were a Leica TS02 total station with 3’’ angular accuracy and 1.5 mm ± 2 ppm spatial accuracy and a Sony A5100 photographic camera with an Exmor APS- CMOS sensor, 23.5 x 15.6 mm and 20 Megapixels.
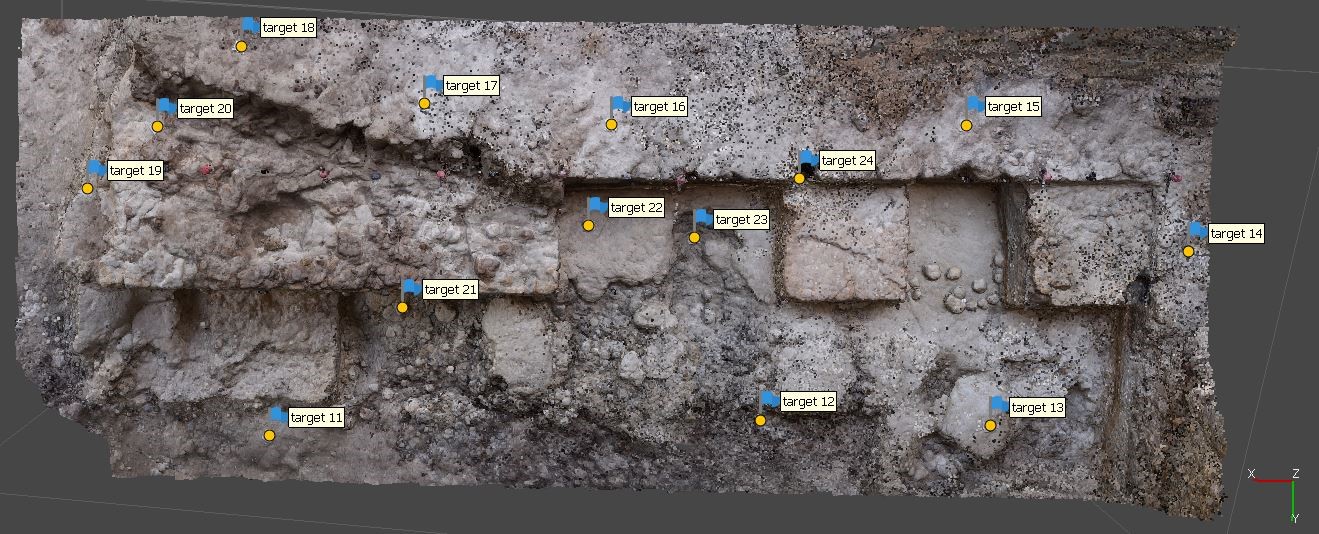
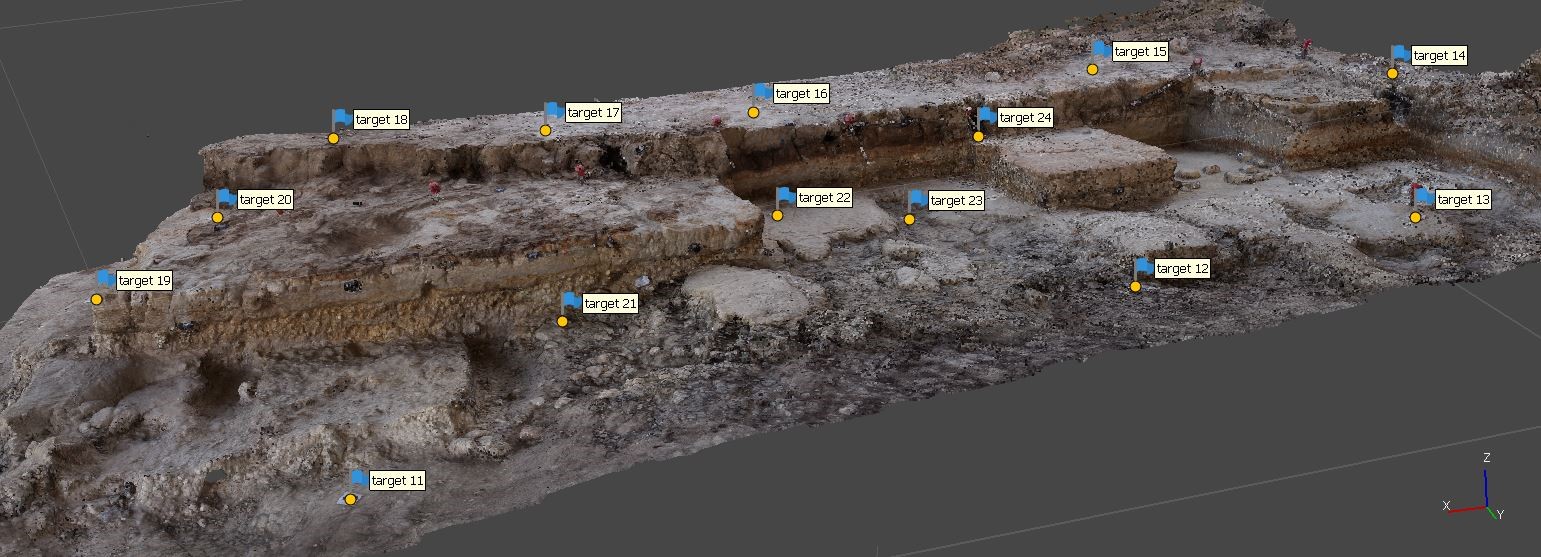
Firstly, 14 GCPs (Ground Control Points) were established at the site for the time of the excavation campaign. A number greater than 8 GCPs was chosen, this being the minimum number established by Nagendran et al. (2018), to ensure a reliable photogrammetric output. The GCPs were distributed along the edges and within the site in a stratified way (fig. 6), following Martínez-Carricondo et al. (2018). The GCPs were fixed to the terrain using nails to prevent displacement because the archaeological site is heavily frequented by staff members during excavation; each GCP had a nail in the centre of the drawn target. Then, the total station was used to establish the coordinates of the 14 GCPs in a local reference system.
Figure 6. Sector of the Barranco León archaeological site, Orce (Granada). The blue flags correspond to the GCPs. As shown in the figure, they are distributed over the entire surface, with GCPs at different heights and around the entire contour. ^
Once the system was set up, a series of photographs of the excavation (n = c. 130) were taken with an overlap of more than 87.5% (Eisenbeiss, 2009) were taken on each excavation day for subsequent photogrammetric restitution. Photographs were taken at a distance of approximately 1.5 to 2.0 m from the ground surface, parallel to the surface. Therefore, we took some photos with the camera in a nadiral position (parallel to the ground) and some with the camera in an azimuth position (parallel to the wall), guaranteeing the overlap mentioned above. Regarding lighting, the archaeological site is open on two sides, which limits the presence of shadows, and the photographs were taken at a time of day when sharpness was maximum. For this research, photographs were taken on the 4 specific days of the 2020 BL field season that excavations could take place, on 22, 27, and 29 July, 2020.
2.1.2. Desk work
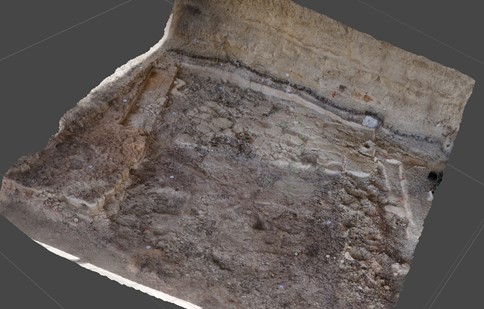
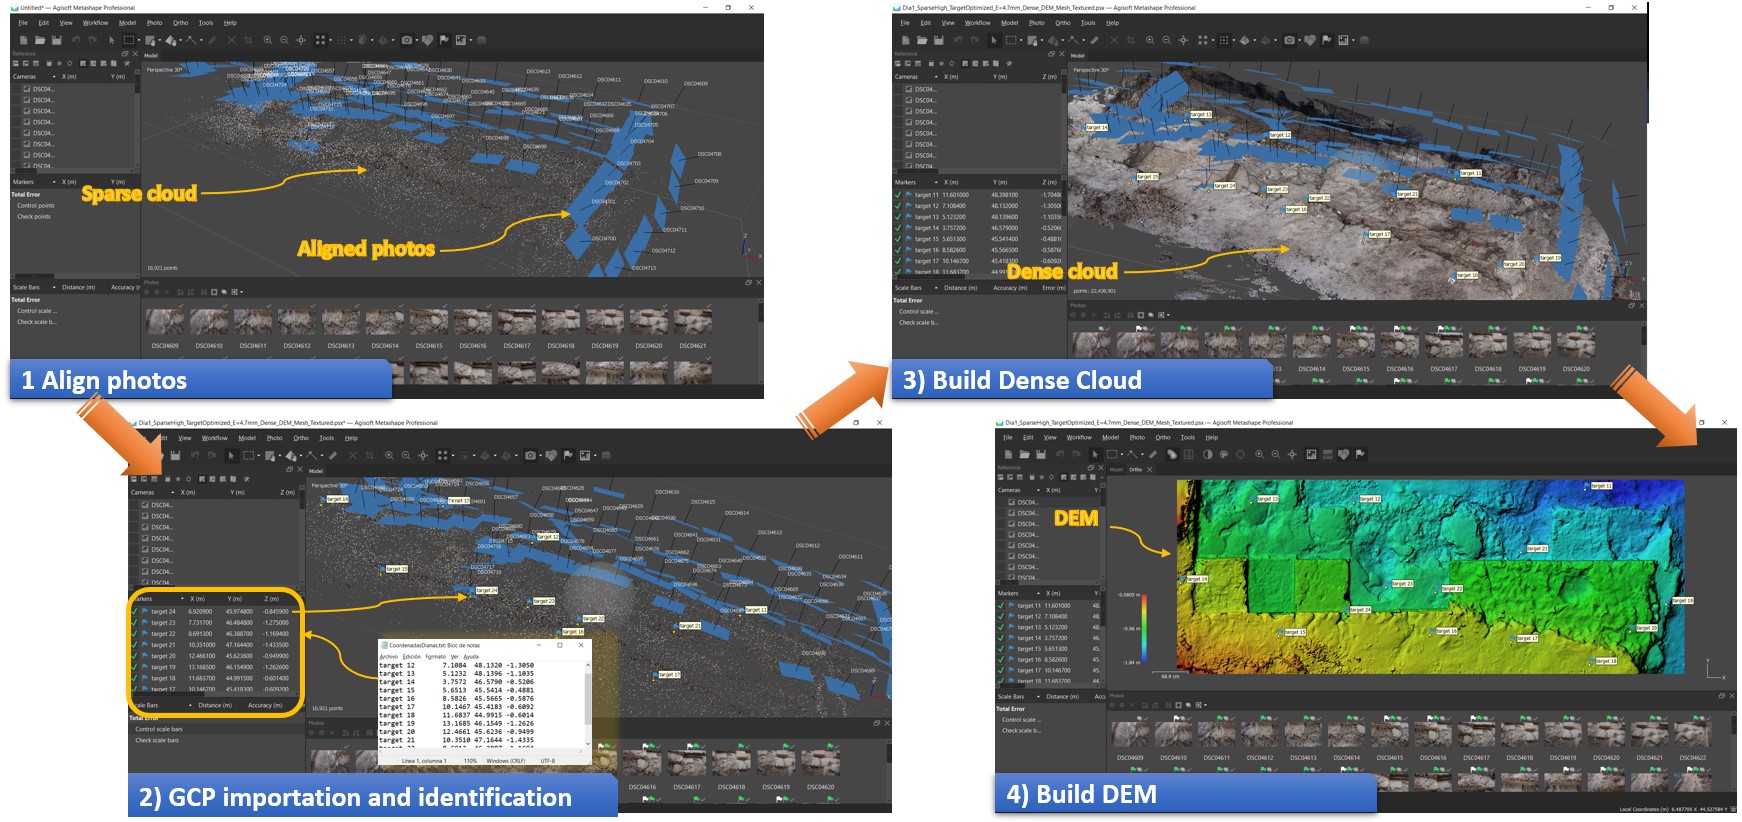
For the desk work, the following two software programs were used: Agisoft Metashape for photogrammetry and QGIS 3.14 to process the DEM raster. Thus, with each set of 130 photographs per day and the coordinates of the 14 GCPs fixed, a dense cloud of points (n = c. 18 million) was generated in the local reference system using Agisoft Metashape. The process for generating the point clouds in a local reference system entailed the following workflow (fig. 7): 1) Align photos. This process begins with the alignment of the photographs. The output of this step is to establish the relative position of all the photos with respect to a single reference photo, randomly selected by the program, and a sparse point cloud. 2) GCP importation and identification. This step involves importing the GCP coordinates from a txt file into the software and then manually identifying the GCP points present in each photograph. 3) Build a dense cloud. In this step, the software generates a dense point cloud within the GCP-defined local reference system. 4) Build the DEM. The desired Digital Elevation Model is generated, after which the level of detail of the raster can be chosen together with the spatial accuracy or the size of terrain that each pixel represents. In Agisoft Metashape the variable is called “pixel size” in the DEM menu export. In our case, all the rasters were generated with a 0.007m cell size.
Figure 7. Workflow in Agisoft Metashape to generate a DEM. ^
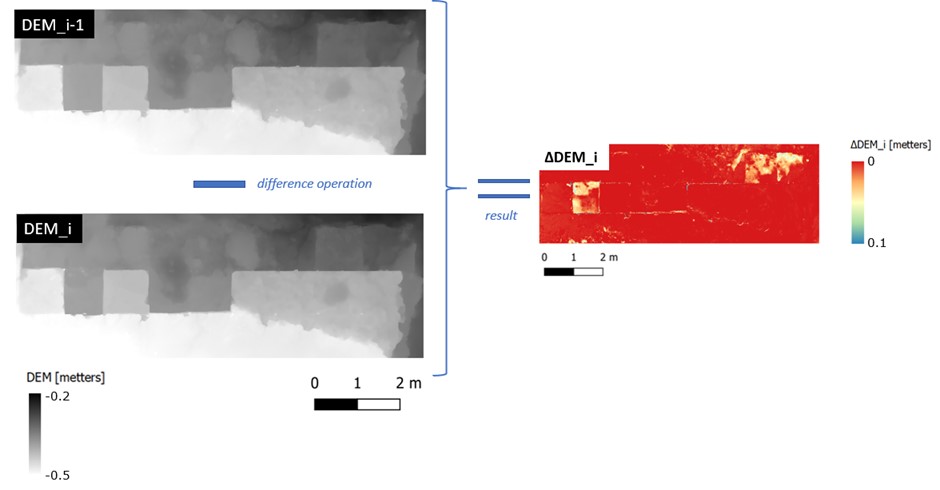
At the end of the second day of excavation, we generated the DEM of the first day and the DEM of the second day in order to define the difference between the two DEMs at the pixel level, generating a differential elevation raster, in which each pixel contained the height value difference between both DEMs (ΔDEMi), as shown in Eq. 1 and figure 8. To do that, we employed two Qgis functions. The first one was the clipping of the DEMs (Raster->Extraction -> Clip Raster by extent). For the clip, the same clip points were used for all the DEMs since each DEM come from a point cloud that is in the same local reference coordinate system that was established in 2017 at the beginning of the excavation works of the project on which finance this research. The next function used was DEM difference. To carry out this function, we employed Qgis raster calculator (Raster-> Raster Calculator). Once the above was done, and at the end of each day, we returned to the workflow point II (fig. 5) and the whole process described was repeated from that point on. In this way, a ΔDEMi raster was created for each day of excavation of the deposit - 1.
A cost analysis is useful to assess the method’s viability as well as its advantages and disadvantages. Firstly, a cost unit was assumed for each of the resources required in an excavation in order to estimate the cost of the proposed method with respect to the full cost of an excavation campaign. In this way, table 2 of equivalences was considered for the resources needed in an excavation. These equivalences are based on the authors’ experience directing archaeological excavations.
Table 2. Assumption of the excavation resources cost units.
HUMAN RESOURCES
MATERIAL RESOURCES
Resource
Cost Unit/day
Resource
Cost Unit/day
Excavation director
10
Excavation tools
5
Engineer
4
Total station kit
3
Technical support staff
2
Camera
1
Excavation staff
1
Agisoft Metashape
2
Qgis
0
On the basis of the data presented in table 2, it is possible to estimate the full cost of a potential excavation in the established cost units. Thus, in the case of some excavation campaigns, a time of 10 working days was used, with 1 excavation director, 1 engineer, 1 technical support staff, and 10 excavation staff together with 10 sets of excavation tools, 1 complete station kit, 1 camera, and 1 Agisoft Metashape license. Thus, the cost of the total excavation was 757 cost units (tab. 3).
Table 3. Breakdown of the resources required for some excavation campaign and their costs in cost units.
Resource
Number of resources
Number of days
Cost unit/day
Cost
[Cost units]
Human resources
Excavation director
1
10
10
100
Engineer
1
1
4
4
Technical support staff
1
10
2
20
Excavation staff
10
10
1
100
Material resources
Excavation tools
10
10
5
500
Total station kit
1
1
3
3
Camera
1
10
1
10
Agisoft Metashape
1
10
2
20
TOTAL
757
Table 4 breaks down the time spent on each phase as well as the material and human resources required for the method presented in this paper.
In terms of time spent in each process of the proposed method (fig. 5), the I. GCP was estimated to take an average of 2 hours, this estimate being made only once, i.e. at the beginning of the excavation campaign. During the excavation campaign, it was not necessary to carry out phase I., GCP, unless several GCPs were accidentally moved. As for phase II., PHOTOGRAPHS, this process serves to determine the volumetric state of that instant in time. The completion of the set of photographs should not take more than 15 min. Regarding the desk processes (phase III., POINT CLOUD; phase IV., DEM; and phase V., HEIGHT DIFFERENCE), a variable amount of time may be needed, depending on the processing capacity of the microprocessor, the graphics card, the RAM memory, etc. (Barrile et al., 2017; Kingsland, 2020). The time estimated in table 4 corresponds to a computer assembled with the following components: Intel Core i7 4790, NVIDIA Geforce GTX 1060 6 Gb, and 32 Gb of RAM, respectively.
Table 4. Table of human resources, material resources, time spent in each of the method phases. (*) It is a time in which the computer workstation is processing autonomously. It only requires 10 minutes of dedication from one person.
Phases
Time spent
Human resources
Material resources
I. GCP
120 minutes
1x engineer y 1x technical support staff
Total station kit and camera
II. PHOTOGRAPHS
15 minutes per day
1x technical support staff
III. POINT CLOUD
120 minutes per day (*)
1x technical support staff o
Agisoft y Qgis
IV. DEM
5 minutes per day
1x technical support staff
V. HEIGHT DIFFERENCE
5 minutes per day
1x technical support staff
With regard to human resources, the phase I., GCP, required an engineer and a technical support staff. For the other phases (II., III., IV., and V.) a trained technical support staff member may suffice to carry out each of the processes. The cost units represented by these human resources are outlined in table 5.
Table 5. Breakdown of the necessary resources of the method proposed for an excavation campaign and their costs in cost units.
Resource
Number of resources
Number of days
Cost unit/day
Cost
[Cost units]
Human resources
Engineer
1
1
4
4
Technical support staff
1
10
2
20
Material resources
Total station kit
1
1
3
3
Camera
1
10
1
10
Agisoft Metashape
1
10
2
20
TOTAL
57
In terms of material resources, a total station kit and a series of targets were required to complete phase I. GCP. Typically, a complete kit includes a prism, tripod, and a total station. For phase II., PHOTOGRAPHS, we used the camera described in Section 2.1.1. For desk-based processing, a computer workstation and two software programs, i.e. Agiosft Photoscan and Qgis, were necessary. The cost units represented by these material resources are outlined in table 5.
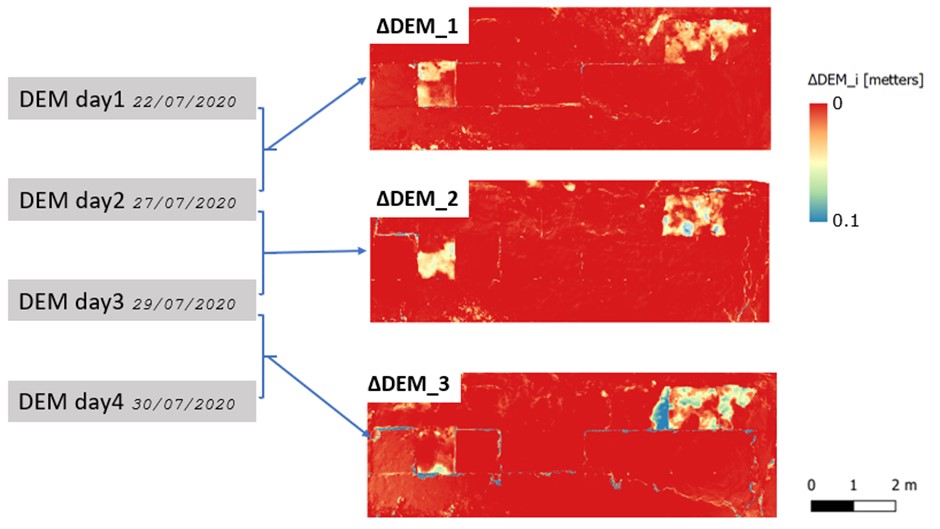
The first main output resulting from the method outlined above is a dense point cloud for each of the 4 sets of photographs corresponding to the 4 different days. The specific characteristics of each point cloud are presented in table 6. The average number of points in each dense cloud was 18,606,036, with an average mean square error (MSE) of 5.85 mm. The MSE measures the average of the x,y,z errors and it was calculated over the GCP using Agisoft Metashape. DEMs for each point cloud were generated at a resolution of 7 mm. The number of pixels of the DEMs is 1363 x 481, thus covering an area of the ground plan of 9541 mm x 3367 mm. By computing the differences between consecutive daily DEMs (Eq. 1), we generated three raster time series (∆DEM_i) that document the progress over the four days in which excavation took place (fig. 9).
Table 6. Descriptive variables of each dense point cloud obtained.
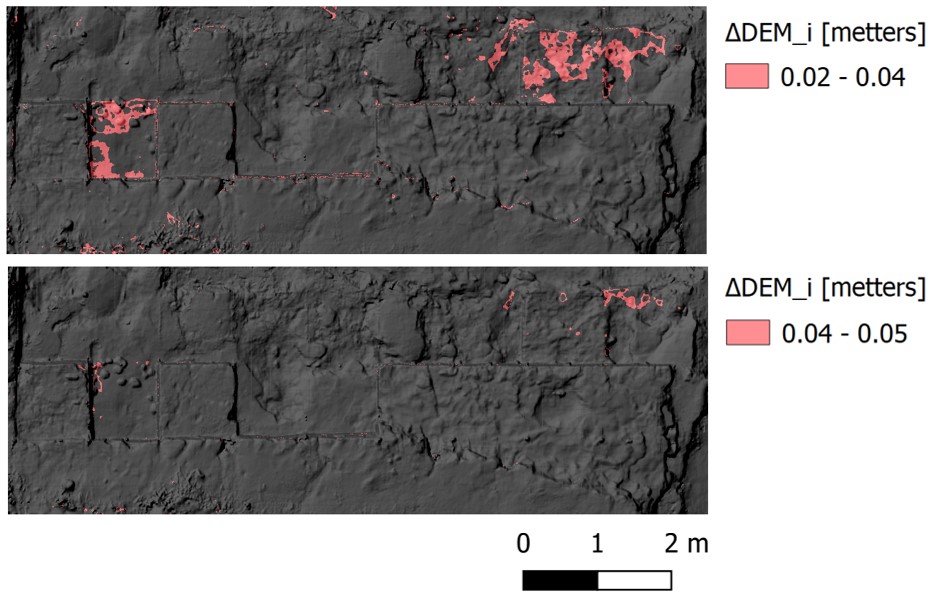
The raster time series (∆DEM_i) could then be filtered or searched to detect and quantify excavation progress and colour in the digital model excavated areas on the basis of specified centimetre thresholds. This approach makes it feasible to quickly and accurately reference in three dimensions the most relevant archaeological remains, filtering according to their dimensions. Some examples of the filters applied are shown in figure 10.
The costs of the proposed method with respect to the costs of a complete excavation campaign are reflected in the data from table 2 and table 5, showing that the total cost of a campaign was 757 cost units and that of the proposed method was 57 cost units. Thus, the percentage cost of the proposed method with respect to the cost of the total excavation was 7.5%.
As explained in the Material and Method section, the excavation in the prepandemic campaigns (2017-2019) was monitored daily by means of drawings or sketches of specific areas in combination with the taking of images. The sketches were made mostly by the excavation staff under the supervision of the excavation director, who had the broadest overall vision of the campaign and knew which finds should or should not be inventoried in more detail.
The current COVID-19 pandemic obliged us to design a protocol for monitoring the excavation, taking into account mainly two major limitations: 1) a possible immediate halt of the excavation process by health authorities and 2) a reduced number of excavation staff; 6 excavation staff in the 2020 campaign compared to 12, 14 and 10 in the 2017, 2018 and 2019 campaigns, respectively. Therefore, we undertook a much more exhaustive monitoring by means of practically daily photogrammetric surveys, anticipating an immediate cancellation of the excavation from one day to the next, eliminating the time spent preparing sketches and instead making photogrammetric surveys. In addition, the taking of images required the presence of a single person, thus reducing the chances of contracting the virus.
The current method and its results made it possible to monitor the excavation, providing the following advantages over the previous method: a) Reducing the personnel necessary to take and process the photographs to one trained technician. By contrast, the traditional method requires several excavation team members as well as the excavation director to supervise the sketches made. b) Regarding time, our method required about 120 min for positioning and setting the coordinates of the targets as well as some 30 min per day of work by the technical staff (15 min photographs + 15 min desk work). In the conventional method, a sketch requires approximately 45 to 60 min. c) Digitization notably improved the inventory of the data, its durability over time, and its ability to be shared with other researchers. d) Regarding the invasiveness and ease of the new method, as specified in Section 2., it would require only the placement of markers and the taking of photographs, so it can be considered an expeditious and non-invasive method. e) The spatial resolution of the ∆DEMs generated was 7 mm.
With this method, the first excavation day requires an engineer and a total station kit. The total station and the engineer could belong to the excavation team or could be hired on an ad hoc basis for that day. In any case, we recommend that they become part of the team due to problems that could arise from an unexpected movement of the GCPs, given that, in the study case, the archaeological site is heavily frequented by the staff during the excavation and thus vulnerable to unexpected movement of the GCPs. The method takes the above into account since it places a number of GCPs greater than that recommended by Nagendran et al. (2018).
The results of the method were examined and analysed daily. On one occasion, it was noted that the ∆DEM was not consistent, since it presented unexcavated zones with height differences. After analysing the position of the GCPs, we found that some of them had been displaced by a few mm, so the next morning, just before the beginning of the excavation, we repositioned the GCPs and repeated the photos.
Knowing the position where archaeological remains have been found and their size on each of the axes, it is possible to filter on ∆DEM_i to highlight areas whose DEM difference corresponds to the measurement of the archaeological remains on its axis perpendicular to the ground plane. In this way, it is possible to know exactly from where they have been extracted. An example of filtering is shown in figure 10.
Figure 10. Examples of filters made on any ΔDEM for the detection of excavated areas with the desired centimeters. ^
Most of the photogrammetry application for archaeological documentation are usually applied to archaeological sites with complex morphology and often deep stratigraphical sequences, mostly created or influenced by human activity. In the case of this research, the morphology is not very complex, but the application of photogrammetry is still useful, since it provides much more information than traditional methods, such as sketches.
Discussing the contributions of the excavation monitoring method described in this document in relation to the current methods that use photogrammetry algorithms; Callieri et al. (2011) makes a first approach of what can be achieve using photogrammetry in an archaeological site but does not develop any DEM from the 3D models obtained; Rinaudo et al. (2012) obtains just a point cloud and a DEM from the archaeological a Roman archaeological village located in Aquileia, but does not periodically monitor the excavation in the way proposed by this method; Waagen (2019) performs periodic DEMs but does not obtain the difference of DEM since his study focuses on different issues than those raised in this paper; Martínez-Fernández et al. (2020) makes a very in-depth analysis of the excavation monitoring by means of the DEM difference and by volume differences of the 3D models obtained, but does not carry out a daily or weekly monitoring as proposed by the presented method. So, the focus of this contribution is a method for daily monitoring of an archaeological excavation so the director(s) can visualise DEM differences on a daily basis to efficiently inform any relevant fieldwork decisions.
The method presented here allows the monitoring of an archaeological excavation in an expeditious, non-invasive way, with spatial and temporal accuracy. These datasets offer relevant information to site directors, which can be used to inform relevant fieldwork decisions. Furthermore, the flexibility of the method enables a subset of photographs to be taken as necessary, to make complete or partial 3D models of specific parts of the site at any given time.
In addition, the method requires an engineer to take the coordinates of a series of GCPs in a timely manner and a technician to take the photographs and process the data. The time employed by the technician to take the photographs will not generally exceed 15 min and data processing time is also often less than 15 min. Moreover, the method allows the results to be shared immediately with the excavation director and/or with other researchers. On the basis of our estimated cost analysis, implementing this method would only represents 7.5% of an excavation campaign’s budget.
Regarding the resulting output (an elevation difference raster presented as a time series [known as ∆DEM_i]) the excavation team can georeference any relevant archaeological remains found on two successive days by filtering the desired height difference in the daily ∆DEM_i raster. This assists the excavation team to monitor the retrieval of archaeological remains, pinpointing the position where an object is found and speeding the inventory process.
this research has been funded by Consejería de Cultura, Junta de Andalucía, grant number BC.03.032/17 and by FEDER 2020 Operative Program Research Project number A-HUM-016-UGR18. The funder (Consejería de Cultura, Junta de Andalucía) authorizes the publication of these results. JMJ-A belongs to the Junta de Andalucía Research Group HUM-607 and to the Unit of Excellence “Archaeometrical Studies. Inside the Artefacts and Ecofacts” (University of Granada, Spain).
Agustí, J., Blain, H.A., Lozano-Fernández, I., Piñero, P., Oms, O., Furió, M., Blanco, A., López-García, J.M. and Sala, R. (2015) “Chronological and environmental context of the first hominin dispersal into Western Europe: The case of Barranco León (Guadix-Baza Basin, SE Spain)”, Journal of Human Evolution, 87, pp. 87–94. https://doi.org/10.1016/j.jhevol.2015.02.014
Anadón, P., Oms, O., Riera, V. and Julià, R. (2015) “The geochemistry of biogenic carbonates as a paleoenvironmental tool for the Lower Pleistocene Barranco León sequence (BL-5D, Baza Basin, Spain)”, Quaternary International, 389, pp. 70–83. https://doi.org/10.1016/j.quaint.2014.09.062
Armstrong, B.J., Blackwood, A.F., Penzo-Kajewski, P., Menter, C.G. and Herries, A.I.R. (2018) “Terrestrial laser scanning and photogrammetry techniques for documenting fossil-bearing palaeokarst with an example from the Drimolen Palaeocave System, South Africa”, Archaeological Prospection, 25 (1), pp. 45–58. https://doi.org/10.1002/arp.1580
Baird. J.A. (2014) “Towards an archaeology of archaeological archives”, Archaeological Review from Cambridge 29 (2), pp. 14-32.
Barrile, V., Bilotta, G. and Nunnari, A. (2017) “3D modeling with photogrammetry by UAVs and model quality verification”, ISPRS Ann. Photogramm. Remote Sens. Spat. Inf. Sci., IV-4/W4, pp. 129-134. https://doi.org/10.5194/isprs-annals-IV-4-W4-129-2017
Blain, H. A., Lozano-Fernández, I., Agustí, J., Bailon, S., Menéndez Granda, L., Espígares Ortiz, M. P., Ros-Montoya, S., Jiménez Arenas, J. M., Toro-Moyano, I., Martínez-Navarro, B. and Sala, R. (2016) “Refining upon the climatic background of the Early Pleistocene hominid settlement in western Europe: Barranco León and Fuente Nueva-3 (Guadix-Baza Basin, SE Spain)”, Quaternary Science Reviews, 144, pp. 132–144. https://doi.org/10.1016/j.quascirev.2016.05.020
Bohil, C. J., Alicea, B. and Biocca, F. A. (2011) “Virtual reality in neuroscience research and therapy”, Nature Reviews Neuroscience 12 (12), pp. 752–762. https://doi.org/10.1038/nrn3122
Brown, D. (1976) “The bundle adjustment- Progress and prospects”, XIII Congress of the ISPRS. International Archives of Photogrammetry, 21 (3), 33.
Bruckheimer, E., Rotschild, C., Dagan, T., Amir, G., Kaufman, A., Gelman, S. and Birk, E. (2016) “Computer-generated real-time digital holography: First time use in clinical medical imaging”, European Heart Journal Cardiovascular Imaging, 17 (8), pp. 845–849. https://doi.org/10.1093/ehjci/jew087
Callieri, M., Dell’Unto, N., Dellepiane, M., Scopigno, R., Soderberg, B and Larsson, L. (2011) “Documentation and Interpretation of an Archeological Excavation: an Experience with Dense Stereo Reconstruction Tools”, The 12th International Symposium on Virtual Reality, Archaeology and Cultural Heritage VAST. Goslar: Eurographics Association, pp. 33-40.
Carrocera Fernández, E., Díaz Nosty, B. and Piedra, G. S. (2007) “Desarrollo de los trabajos excavación arqueológica y seguimiento arqueológico de las obras de restauración de Santa María del Naranco (Oviedo)”, Excavaciones arqueológicas en Asturias 2003-2006, pp. 331-338.
Castillo, A. D., Nicolau, A. C., Puchol, O. G. and Ruiz, P. E. (2017) “3D environment for the analysis and virtual reconstruction of the archaeological fieldworks at Cocina Cave (Dos Aguas, Valencia, Spain)”, Virtual Archaeology Review, 8 (17), pp. 75–83. https://doi.org/10.4995/VAR.2017.7028
Costa-Cabral, M. C. and Burges, S. J. (1994) “Digital Elevation Model Networks (DEMON): A model of flow over hillslopes for computation of contributing and dispersal areas”, Water Resources Research, 30 (6), pp. 1681–1692. https://doi.org/10.1029/93WR03512
De Reu, J., De Smedt, P., Herremans, D., Van Meirvenne, M., Laloo, P. and De Clercq, W. (2014) “On introducing an image-based 3D reconstruction method in archaeological excavation practice”, Journal of Archaeological Science, 41, pp. 251–262. https://doi.org/10.1016/J.JAS.2013.08.020
Dhonju, H.K., Xiao, W., Sarhosis, V., Mills, J.P., Wilkinson, S., Wang, Z., Thapa, L. and Panday, U.S. (2017) “Feasibility study of low-cost image-based heritage documentation in Nepal”, International Archives of the Photogrammetry, Remote Sensing and Spatial Information Sciences - ISPRS Archives, 42 (2W3), pp. 237–242. https://doi.org/10.5194/ISPRS-ARCHIVES-XLII-2-W3-237-2017
Elnima, E. (2015) “A solution for exterior and relative orientation in photogrammetry, a genetic evolution approach”, Journal of King Saud University Engineering Sciences, 27 (1), pp. 108–113.
Enríquez, C., Jurado, J.M., Bailey, A., Callén, D., Collado, M.J., Espina, G., Marroquín, P., Oliva, E., Osla, E., Ramos, M. I., Sarceño, S. and Feito, F. R. (2020) “The UAS-Based 3D Image Characterization of Mozarabic Church Ruins in Bobastro (Malaga), Spain”, Remote Sensing, 12 (15), 2377. https://doi.org/10.3390/RS12152377
Fischler, M.A. and Bolles, R.C. (1981) “Random sample consensus: a paradigm for model fitting with applications to image analysis and automated cartography”, Communications of the ACM, 24 (6), pp. 381–395. https://doi.org/10-.1145/358669.358692
Fisher, M.L. (2013) “Fire detection with a frame-less vision sensor working in the NIR band”, Advances in forest fire research 4 (4), pp. 23–30.
Gaulton, R., Taylor, J. and Watkins, N. (2015) “Unmanned aerial vehicles for pre-harvest biomass estimation in willow (Salix spp.) coppice plantations”, ISPRS - International Archives of the Photogrammetry, Remote Sensing and Spatial Information Sciences GeoUAV, September 2014, 1–4. Available online: https://geouav.teledetection.fr/papers/GEOSPATIAL_WEEK_2015_284.pdf
Gibert, J., Gilbert, L., Iglesias, A. and Maestro, E. (1998) “Two ’Oldawan’ assemblages in the Plio-Pleistocene deposits of the Orce region, southeast Spain”, Antiquity, 72 (275), pp. 17–25.
Gil-Docampo, M., Peña-Villasenín, S. and Ortiz-Sanz, J. (2020) “An accessible, agile and low-cost workflow for 3D virtual analysis and automatic vector tracing of engravings: Atlantic rock art analysis”, Archaeological Prospection, 27 (2), pp. 153–168. https://doi.org/10.1002/arp.1760
González-Quiñones, J., Reinoso-Gordo, J., León-Robles, C., García-Balboa, J., Ariza-López, F. (2018) “Variables Influencing the Accuracy of 3D Modeling of Existing Roads Using Consumer Cameras in Aerial Photogrammetry”, Sensors, 18, 3880. https://doi.org/10.3390/s18113880
Goodale, C., Aber, J. and Ollinger, S. (1998) “Mapping monthly precipitation, temperature, and solar radiation for Ireland with polynomial regression and a digital elevation model”, Climate Research, 10 (1), pp. 35–49. https://doi.org/10.3354/cr010035
Hartley, R. and Zisserman, A. (2000). Multiple view geometry in computer vision. Cambridge: Cambridge University Press.
Hast, A., Nysjö, J. and Marchetti, A. (2013) “Optimal RANSAC-Towards a Repeatable Algorithm for Finding the Optimal Set”, Journal of WSCG, 21 (1), pp. 21–30.
Heipke, C. (1997) “Automation of interior, relative, and absolute orientation”, Photogrammetry and Remote Sensing, 52(1), pp. 1–19.
Henestrosa, Á.R., Román Punzón, J.M., Alcaide, M.M. and Montes, P.R. (2022) “The Implementation of Digital Techniques for Archaeological Documentation in the Roman Villa of Salar (Granada)”, Vegueta, 22 (1), pp. 113–136. https://doi.org/10.51349/VEG.2022.1.07
Hoffmeister, D., Zellmann, S., Pastoors, A., Kehl, M., Cantalejo, P., Ramos, J., Weniger, G. C. and Bareth, G. (2016) “The Investigation of the Ardales Cave, Spain – 3D Documentation, Topographic Analyses, and Lighting Simulations based on Terrestrial Laser Scanning”, Archaeological Prospection, 23 (2), pp. 75–86. https://doi.org/10.1002/arp.1519
Hsieh, Y.C., Chan, Y.C. and Hu, J.C. (2016) “Digital elevation model differencing and error estimation from multiple sources: A case study from the Meiyuan Shan landslide in Taiwan”, Remote Sensing, 8 (3), 199. https://doi.org/10.3390/rs8030199
Kingsland, K. (2020) “Comparative analysis of digital photogrammetry software for cultural heritage”, Digital Applications in Archaeology and Cultural Heritage, 18, e00157. https://doi.org/10.1016/j.daach.2020.e00157
León-Robles, C.A., Reinoso-Gordo, J.F. and González-Quiñones, J.J. (2019) “Heritage building information modeling (H-BIM) applied to a stone bridge”, ISPRS International Journal of Geo-Information, 8 (3), 121. https://doi.org/10.3390/ijgi8030121
Leutenegger, S., Chli, M. and Siegwart, R.Y. (2011) “BRISK: Binary Robust invariant scalable keypoints”, Proceedings of the IEEE International Conference on Computer Vision. Barcelona: IEEE, pp. 2548–2555. https://doi.org/10.1109/ICCV.2011.6126542
López, J.A.B., Jiménez, G.A., Romero, M.S., García, E.A., Martín, S.F., Medina, A.L. and Guerrero, J.A.E. (2016) “3D modelling in archaeology: The application of Structure from Motion methods to the study of the megalithic necropolis of Panoria (Granada, Spain)”, Journal of Archaeological Science: Reports, 10, pp. 495–506. https://doi.org/10.1016/J.JASREP.2016.11.022
Lourakis, M.I.A. and Argyros, A.A. (2009) “SBA: A Software Package for Generic Sparse Bundle Adjustment”, ACM Transactions on Mathematical Software, 36 (1), pp. 1–30. https://doi.org/10.1145/1486525.1486527
Maldonado-Garrido, E., Piñero, P. and Agustí, J. (2020) “A catalogue of the vertebrate fossil record from the Guadix-Baza Basin (SE Spain)”, Spanish Journal of Palaeontology, 32 (1), pp. 207-236. https://doi.org/10.7203/sjp.32.1.17040
Martínez-Carricondo, P., Agüera-Vega, F., Carvajal-Ramírez, F., Mesas-Carrascosa, F.J., García-Ferrer, A. and Pérez-Porras, F.J. (2018) “Assessment of UAV-photogrammetric mapping accuracy based on variation of ground control points”, International Journal of Applied Earth Observation and Geoinformation, 72, pp. 1–10. https://doi.org/10.1016/j.jag.2018.05.015
Martínez-Fernández, A., Benito-Calvo, A., Campaña, I., Ortega, A.I., Karampaglidis, T., Bermúdez de Castro, J. M. and Carbonell, E. (2020) “3D monitoring of Paleolithic archaeological excavations using terrestrial laser scanner systems (Sierra de Atapuerca, Railway Trench sites, Burgos, N Spain)”, Digital Applications in Archaeology and Cultural Heritage 19, e00156.
Martínez-Navarro, B., Palmqvist, P., Madurell-Malapeira, J., Ros-Montoya, M., Espigares, P., Torregrosa, V. and Pérez-Claros, J. A. (2010) “La fauna de grandes mamíferos de Fuente Nueva-3 y Barranco León-5: estado de la cuestión”, in Martínez Navarro, B., Agustí i Ballester, J. y Toro-Moyano, I. (coords), Ocupaciones Humanas En El Pleistoceno Inferior y Medio de La Cuenca de Guadix-Baza. Sevilla: Junta de Andalucía, pp. 197–236.
Martínez-Navarro, B., Madurell-Malapeira, J., Ros-Montoya, S., Espigares, M.P., Medin, T., Hortolà, P. and Palmqvist, P. (2015) “The Epivillafranchian and the arrival of pigs into Europe”, Quaternary International, 389, pp. 131–138. https://doi.org/10.1016/j.quaint.2015.09.039
Masson-MacLean, E., O’Driscoll, J., McIver, C. and Noble, G. (2021) “Digitally Recording Excavations on a Budget: A (Low-Cost) DIY Approach from Scotland”, Journal of Field Archaeology, 46 (8), pp. 595–613.
Maune, D. F. (2007) Digital elevation model technologies and applications: the DEM users manual. Bethesda: American Society for Photogrammetry and Remote Sensing, pp. 99-118.
Mesa-Mingorance, J.L. and Ariza-López, F.J. (2020) “Accuracy assessment of digital elevation models (DEMs): A critical review of practices of the past three decades”, Remote Sensing, 12 (16), 2630. https://doi.org/10.3390/RS12162630
Mikhail, E., Bethel, J. and McGlone, Ch. (2001) Introduction to modern photogrammetry. New York: John Wiley and Sons.
Nagendran, S.K., Tung, W.Y. and Mohamad Ismail, M.A. (2018) “Accuracy assessment on low altitude UAV-borne photogrammetry outputs influenced by ground control point at different altitud”, IOP Conference Series: Earth and Environmental Science, 169, 012031. https://doi.org/10.1088/1755-1315/169/1/012031
Novo, A., Lorenzo, H., Rial, F.I. and Solla, M. (2010) “From pseudo-3D to full-resolution GPR imaging in archaeology: A complex Roman site in Lugo, Spain”, Proceedings of the 13th Internarional Conference on Ground Penetrating Radar, pp. 1-6. https://doi.org/10.1109/ICGPR.2010.5550185
Obdržálek, D., Basovník, S., Mach, L. and Mikulík, A. (2010) “Detecting scene elements using maximally stable colour regions”, Communications in Computer and Information Science, 82, pp. 107–115. https://doi.org/10.1007/978-3-642-16370-8_10
Oms, O., Anadón, P., Agustí, J. and Julià, R. (2011) “Geology and chronology of the continental Pleistocene archeological and paleontological sites of the Orce area (Baza basin, Spain)”, Quaternary International, 243 (1), pp. 33–43. https://doi.org/10.1016/j.quaint.2011.03.048
Oms, O., Parés, J.M., Martínez-Navarro, B., Agustí, J., Toro, I., Martínez-Fernández, G. and Turq, A. (2000) “Early human occupation of western Europe: Paleomagnetic dates for two paleolithic sites in Spain”, Proceedings of the National Academy of Sciences of the United States of America, 97 (19), pp. 10666–10670. https://doi.org/10.1073/pnas.180319797
Parsons, T.D., Riva, G., Parsons, S., Mantovani, F., Newbutt, N., Lin, L., Venturini, E. and Hall, T. (2017) “Virtual reality in pediatric psychology”, Pediatrics, 140 (2), pp. S86–S91. https://doi.org/10.1542/peds.2016-1758I
Parsons, T.D. and Rizzo, A.A. (2008) “Affective outcomes of virtual reality exposure therapy for anxiety and specific phobias: A meta-analysis”, Journal of Behavior Therapy and Experimental Psychiatry, 39 (3), pp. 250–261. https://doi.org/10.1016/j.jbtep.2007.07.007
Peng, F., Lin, S.C., Guo, J., Wang, H. and Gao, X. (2017) “The Application of SfM Photogrammetry Software for Extracting Artifact Provenience from Palaeolithic Excavation Surfaces” Journal of Field Archaeology, 42 (4), pp. 326-336, https://doi.org/10.1080/00934690.2017.1338118
Portalésa, C., Alonso-Monasteriob, P. and Viñalsc, M. J. (2017) “3D virtual reconstruction and visualisation of the archaeological site Castellet de Bernabé (Llíria, Spain)”, Virtual Archaeology Review, 8 (16), pp. 72–85. https://doi.org/10.4995/VAR.2017.5890
Reinoso-Gordo, J.F., Barsky, D., Serrano-Ramos, A., Solano-García, J.A., León-Robles, C. A., Luzón-González, C., Titton, S. and Jiménez-Arenas, J.M. (2020) “Walking among mammoths. remote sensing and virtual reality supporting the study and dissemination of pleistocene archaeological sites: The case of fuente nueva 3 in Orce, Spain”, Sustainability, 12 (11), 4785. https://doi.org/10.3390/su12114785
Reinoso, J.F. (2010) “A priori horizontal displacement (HD) estimation of hydrological features when versioned DEMs are used”, Journal of Hydrology, 384 (1–2), pp. 130–141. https://doi.org/10.1016/j.jhydrol.2010.01.017
Repola, L., Scotto di Carlo, N., Signoretti, D. and Leidwanger, J. (2018) “Virtual simulation of a late antique shipwreck at Marzamemi, Sicily: Integrated processes for 3D documentation, analysis and representation of underwater archaeological data”, Archaeological Prospection, 25(2), pp. 99–109. https://doi.org/10.1002/arp.1592
Rinaudo, F., Chiabrando, F., Lingua, A. and Spanò, A. (2012) “Archeological site monitoring: UAV Photogrammetry can be an answer”, International Archives of the Photogrammetry, Remote Sensing and Spatial Information Sciences, XXXIX(B5), pp. 583–588.
Rublee, E., Rabaud, V., Konolige, K. and Bradski, G. (2011) “ORB: An efficient alternative to SIFT or SURF”, 2011 International Conference on Computer Vision, 2564–2571. https://doi.org/10.1109/ICCV.2011.6126544
Sánchez-Bandera, C., Oms, O., Blain, H. A., Lozano-Fernández, I., Bisbal-Chinesta, J.F., Agustí, J., Saarinen, J., Fortelius, M., Titton, S., Serrano-Ramos, A., Luzón, C., Solano-García, J., Barsky, D. and Jiménez-Arenas, J.M. (2020) “New stratigraphically constrained palaeoenvironmental reconstructions for the first human settlement in Western Europe: The Early Pleistocene herpetofaunal assemblages from Barranco León and Fuente Nueva 3 (Granada, SE Spain)”, Quaternary Science Reviews, 243, 106466. https://doi.org/10.1016/j.quascirev.2020.106466
Sancho Gómez-Zurdo, R., Galán Martín, D., González-Rodrigo, B., Marchamalo Sacristán, M. and Martínez Marín, R. (2021) “Aplicación de la fotogrametría con drones al control deformacional de estructuras y terreno”, Informes de La Construcción, 73 (561), e379. https://doi.org/10.3989/IC.77867
Snavely, N., Seitz, S. M. and Szeliski, R. (2008) “Modeling the World from Internet Photo Collections”, International Journal of Computer Vision, 80 (2), pp. 189–210. https://doi.org/10.1007/s11263-007-0107-3
Steen-McIntyre, V., Fryxell, R. and Malde, H. E. (1981) “Geologic evidence for age of deposits at Hueyatlaco archeological site, Vasequillo, Mexico”, Quaternary Research, 16 (1), pp. 1–17. https://doi.org/10.1016/0033-5894(81)90124-1
Titton, S., Barsky, D., Bargalló, A., Serrano-Ramos, A., Vergès, J.M., Toro-Moyano, I., Sala-Ramos, R., Solano, J.G. and Arenas, J.M.J. (2020) “Subspheroids in the lithic assemblage of Barranco León (Spain): Recognizing the late Oldowan in Europe”, PLoS ONE, 15 (1), e0228290. https://doi.org/10.1371/journal.pone.0228290
Titton, S., Oms, O., Barsky, D., Bargalló, A., Serrano-Ramos, A., Solano-Garca, J., Sánchez-Bandera, C., Yravedra, J., Blain, H.-A., Toro-Moyano, I., Jiménez-Arenas, J.M. and Sala-Ramos, R. (2021) “Oldowan stone knapping and percussive activities on a raw material reservoir deposit 1.4 million years ago at Barranco León (Orce, Spain)”, Archaeological and Anthropological Sciences, 13, 108. https://doi.org/10.1007/s12520-021-01353-w
Toro-Moyano, I., Martínez-Navarro, B., Agustí, J., Souday, C., Bermúdez de Castro, J.M., Martinón-Torres, M., Fajardo, B., Duval, M., Falguères, C., Oms, O., Parés, J.M., Anadón, P., Julià, R., García-Aguilar, J.M., Moigne, A.M., Espigares, M.P., Ros-Montoya, S. and Palmqvist, P. (2013) “The oldest human fossil in Europe, from Orce (Spain)”, Journal of Human Evolution, 65 (1), pp. 1–9. https://doi.org/10.1016/j.jhevol.2013.01.012
Triggs, B., McLauchlan, P.F., Hartley, R.I. and Fitzgibbon, A.W. (2000) “Bundle Adjustment — A Modern Synthesis”, in Triggs, B., Zisserman, A., Szeliski, R. (eds) Vision Algorithms: Theory and Practice. Berlin: Springer, pp. 298-372. https://doi.org/10.1007/3-540-44480-7_21
Waagen, J. (2019) “New technology and archaeological practice. Improving the primary archaeological recording process in excavation by means of UAS photogrammetry”, Journal of Archaeological Science, 101, pp. 11–20. https://doi.org/10.1016/J.JAS.2018.10.011
Wang, S., Wang, Y., Hu, Q., Li, J. and Ai, M. (2019) “Unmanned aerial vehicle and structure-from-motion photogrammetry for three-dimensional documentation and digital rubbing of the Zuo River Valley rock paintings”, Archaeological Prospection, 26(3), pp. 265–279. https://doi.org/10.1002/arp.1739
Wessling, R., Maurer, J. and Krenn-leeb, A. (2014) “Structure from Motion for Systematic Single Surface Documentation of Archaeological Excavations”, Proceedings of the 18th International Conference on Cultural Heritage and New Technologies (CHNT 18), pp. 1-13
Yravedra, J., Solano, J. A., Herranz-Rodrigo, D., Linares-Matás, G. J., Saarinen, J., Rodríguez-Alba, J. J., Titton, S., Serrano-Ramos, A., Courtenay, L. A., Mielgo, C., Luzón, C., Cámara, J., Sánchez-Bandera, C., Montilla, E., Toro-Moyano, I., Barsky, D., Fortelius, M., Agusti, J., Blain, H.-A., Oms, O. and Jiménez-Arenas, J. M. (2022) “Unravelling Hominin Activities in the Zooarchaeological Assemblage of Barranco León (Orce, Granada, Spain)”, Journal of Paleolithic Archaeology 5 (1), pp. 1–33. https://doi.org/10.1007/S41982-022-00111-1
Zhang, W. and Montgomery, D.R. (1994) “Digital elevation model grid size, landscape representation, and hydrologic simulations”, Water Resources Research, 30 (4), pp. 1019–1028. https://doi.org/10.1029/93WR03553
 0000-0001-5185-8769
  DVF-2468-2022