DOI: https://dx.doi.org/10.12795/rea.2025.i50.07
Formato de cita / Citation: Herrera-Ríos, A.Y. (2025). Spatial analysis of CO₂ emissions and their relationship with economic activity in the states of Mexico. Revista de Estudios Andaluces,(50), 136-152. https://dx.doi.org/10.12795/rea.2025.i50.07
Correspondencia autora: yurikoherrera@uas.edu.mx (Abril Yuriko Herrera-Ríos)

Spatial analysis of CO₂ emissions and their relationship with
economic activity in the states of Mexico
Análisis espacial de las emisiones de CO2 y su relación con
la actividad económica en los estados de México
Abril Yuriko Herrera-Ríos
yurikoherrera@uas.edu.mx  0000-0001-9301-9285
Facultad de Ciencias Económicas y Sociales, Universidad Autónoma de Sinaloa, Ciudad Universitaria, Blvd. Universitarios, Avenida de las Américas, Unidad 3, s/n. 80010 Culiacán - Sinaloa, México.
|
INFO ARTÍCULO |
ABSTRACT |
|
|
Received: 20/01/2025 Revised: 10/03/2025 Accepted: 05/04/2025 KEYWORDS Spatial econometrics CO₂ emissions Spatial error model |
The present study uses a spatial econometric model to analyze the relationship between carbon dioxide emissions, economic activity, and the state population in Mexico. Official data from 2022 were used, integrating financial, demographic and spatial variables. The results highlight that the Gross State Domestic Product and the population positively and significantly impact emissions. In addition, relevant spatial patterns were identified, highlighting the need to consider economic, demographic, and spatial factors in formulating public policies. This approach allows us to understand the regional interdependence in generating emissions and proposes strategies to design more effective environmental policies. It is concluded that mitigation policies must consider both economic dynamics and spatial interactions to maximize their effectiveness. |
|
|
PALABRAS CLAVE |
RESUMEN |
|
|
Econometría espacial Emisiones de CO₂ Modelo de error espacial |
El presente estudio analiza la relación entre las emisiones de dióxido de carbono, la actividad económica y la población estatal en México, utilizando un modelo econométrico espacial. Se emplearon datos oficiales del año 2022, integrando variables económicas, demográficas y espaciales. Los resultados destacan que el Producto Interno Bruto Estatal y la población tienen un impacto positivo y significativo en las emisiones. Además, se identificaron patrones espaciales relevantes, donde las emisiones de una entidad están influenciadas por las de sus vecinas. Este enfoque permite entender la interdependencia regional en la generación de emisiones y propone estrategias para diseñar políticas ambientales más efectivas. Se concluye que las políticas de mitigación deben considerar tanto las dinámicas económicas como las interacciones espaciales para maximizar su efectividad. |
1. INTRODUCTION
Climate change represents one of the greatest global challenges of the 21st century, with significant impacts on natural and socioeconomic systems. Greenhouse gas (GHG) emissions, particularly carbon dioxide (CO₂), are recognized as major contributors to global warming. Global CO₂ emissions from human activity reached 36.3 gigatonnes in 2021, according to data from the Global Carbon Project (Friedlingstein et al., 2022). This level of emissions reflects a post-pandemic economic recovery but also underscores the persistent dependence on fossil fuels.
At the national level, Mexico is one of the leading emitters of GHG in Latin America, with approximately 440 million tonnes of CO₂ emitted in 2021, according to the National Institute of Ecology and Climate Change (INECC, for its acronym in Spanish) (Instituto Nacional de Ecología y Cambio Climático, 2022). These emissions are closely linked to economic activity, as sectors such as transport, electric power generation and the manufacturing industry are responsible for a substantial part of the national total. Furthermore, the emissions pattern in Mexico presents significant geographic heterogeneity, reflecting the differences in the distribution of economic and industrial activities between states.
At the international level, initiatives such as the Paris Agreement and the Union Nations Sustainable Development Goals (SDG) seek to mitigate GHG emissions by promoting sustainable and renewable energy strategies (UNFCCC, 2015). Developed countries, such as Germany and Sweden, have managed to decouple their economic growth from CO₂ emissions thanks to proactive policies in the energy transition and improvements in efficiency (International Energy Agency, 2021). In contrast, developing countries face significant challenges due to their dependence on conventional energy sources.
The interrelationship between economic development and CO₂ emissions poses a key dilemma for policymakers: how to foster economic growth without exacerbating environmental impact. In Mexico, this issue takes on an urgent character due to the international commitments made under the Paris Agreement, where the country pledged to reduce its total GHG emissions by 22% by 2030, taking 2013 levels as a reference (Gobierno de México, 2020). However, achieving this goal requires a detailed analysis of the underlying dynamics between economic activity and emissions and the spatial disparities in their distribution.
Although numerous studies have explored the relationship between economic growth and greenhouse gas emissions (Stern, 2004; Shahbaz et al., 2013; Dong et al., 2018), few have incorporated a spatial approach considering regional interactions. Recent studies using spatial econometrics and geographic modeling have highlighted the importance of spatial spillovers in emissions, showing that pollution levels in one region are influenced by neighboring economic activity and environmental policies (Zhang & Broadstock, 2020; Zhao et al., 2022; You et al., 2023). These interactions are particularly relevant in the case of Mexico, where the federal states are economically and geographically interconnected, generating spatial patterns of dependence that traditional models do not adequately capture. Furthermore, the impacts of climate change, such as droughts and extreme weather events, exacerbate the socioeconomic vulnerabilities of the country’s poorest regions.
In the global context, countries with advanced economies have partially decoupled economic growth from CO₂ emissions thanks to transitions towards renewable energy sources and improvements in energy efficiency. For example, the European Union reduced its emissions by 34% between 1990 and 2020 despite a GDP growth of approximately 60% in the same period (European Environment Agency, 2023).
Economic growth in developing countries such as Mexico remained closely linked to increased CO₂ emissions. For instance, between 2021 and 2024, Mexico’s Gross Domestic Product (GDP) grew at an average annual rate of 2.8%, while CO₂ emissions followed a similar upward trend, demonstrating a persistent coupling between economic expansion and environmental impact (Emission Index, 2021; Trading Economics, 2022; El País, 2025). Furthermore, states such as Nuevo León and the Estado de México concentrate elevated economic activity and emissions levels. In contrast, states such as Chiapas and Oaxaca show lower contributions in both indicators. This pattern aligns with research emphasizing that economic hubs exhibit higher environmental footprints due to industrial concentration and urbanization (Zhao et al., 2022; You et al., 2023).
This study hypothesizes that CO₂ emissions in Mexico are positively correlated with economic activity, measured through the Gross State Domestic Product (GSDP), and with the state population, as an indicator of demographic pressure. In addition, it is assumed that there are significant spatial effects, where emissions influence emissions in one state in neighboring states due to economic integration and geographic proximity.
Therefore, this study aims to analyze the spatial distribution of CO₂ emissions in relation to economic activity and population in the states of Mexico, using a spatial econometric model (Spatial Error Model, SEM). This approach allows spatial interactions between states to be captured and provides a comprehensive perspective for the design of environmental policies. In particular, the study seeks to evaluate the relationship between GDP and CO₂ emissions at the state level, analyze the role of population in CO₂ emissions, identify spatial patterns of dependence between federative states, and propose recommendations for designing environmental policies based on the model’s findings.
2. THEORY
2.1. Spatial econometrics
Spatial econometrics is a specialized field that addresses the challenges inherent in analyzing georeferenced data by integrating spatial dependence and heterogeneity into econometric models (Anselin, 2013). This approach allows for modeling phenomena exhibiting spatial patterns, such as the distribution of greenhouse gas (GHG) emissions and economic activity. It offers tools to avoid biased estimates that do not consider regional interactions (Bivand & Piras, 2015).
Georeferenced data have become increasingly important in economic and environmental studies in recent decades due to their ability to capture complex spatial dynamics. The integration of georeferencing technologies, such as Geographic Information Systems (GIS) and remote sensing data, has significantly expanded the applications of spatial econometrics. According to LeSage & Pace (2009), these data provide information on geographic location and identify interaction patterns essential for understanding phenomena such as wealth distribution, trade flows, and environmental impacts.
A key component of spatial econometrics is the spatial weights matrix, which defines how regions are interconnected and is essential for capturing spatial relationships in the data. These matrices are built under different criteria, such as geographic contiguity, Euclidean distance, or the intensity of economic relationships between regions. For example, in a contiguity-based matrix, two regions are considered connected if they share a common border. In contrast, in a distance-based matrix, connections are defined according to the geographic proximity between the centers of the regions (Anselin, 2013).
The choice of the matrix type depends on the phenomenon studied and the spatial structure of the data. According to LeSage & Pace (2009), spatial weight matrices not only capture the direct influence of one region on another but also allow for the analysis of indirect effects, which arise when changes in one region influence its neighbours, and these, in turn, affect other, more distant regions. This concept is crucial in studies of CO₂ emissions, where industrial activities in a region can generate externalities that spread beyond its geographical boundaries.
Moreover, these matrices play a fundamental role in interpreting coefficients in spatial models. For example, in a Spatial Error Model (SEM), the weight matrix determines how the autocorrelation in the errors is distributed across regions. This allows for identifying patterns of spatial dependence that would otherwise be hidden in traditional models (Bivand & Piras, 2015).
In recent studies, Zhang et al. (2021) underline the importance of incorporating spatial econometrics to understand how changes in one region affect neighboring regions. This approach also allows for capturing economic and environmental externalities often ignored in traditional models. Research in Europe, for example, has assessed how regional development policies affect local economies, highlighting that infrastructure investments in one region can generate positive spillover effects in neighbouring regions. For instance, Bröcker et al. (2022), in a study on the impact of road infrastructure investments in Central and Eastern Europe, found that such investments led to significant positive spillover effects on the GDP of neighboring regions. Similarly, López-Rodríguez & Faiña (2020) examined the European Union’s cohesion policy. They demonstrated that investments in transport infrastructure not only benefit the targeted regions but also enhance economic development in surrounding areas through regional spillovers. Likewise, in Latin America, spatial models have been used to analyze the spread of epidemics, migration flows, and the economic effects of natural disasters, underlining the relevance of this approach to address interdisciplinary problems (Gutiérrez et al., 2018).
Recent advances in spatial econometrics have improved the ability to model complex phenomena. For example, hybrid methods combining SEM with big data analytics allow capturing spatial patterns with greater precision (Zhang et al., 2021). Furthermore, integrating remote sensing and remote sensing data has expanded the applications of spatial econometrics in studies of GHG emissions and sustainable economic development (Tamura et al., 2018).
In Mexico, these tools are essential to analyzing the spatial dynamics of economic activity and GHG emissions, where spatial interactions can significantly influence public policy outcomes. This approach provides a more robust perspective for designing regional strategies and mitigating the impacts of climate change.
2.2. Spatial effects on CO2 emissions
The analysis of CO₂ emissions from a spatial perspective has gained relevance due to the interdependent nature of environmental problems. According to Zhang et al. (2021), significant inequalities in the distribution of emissions between regions are often determined by factors such as industrial intensity, population density, and access to clean technologies. These inequalities reflect economic disparities and differences in local governments’ capacity to implement effective environmental policies. Xu & Hisano (2024) emphasize that spatial interactions between regions amplify the impacts of environmental policies and create opportunities for collaborative mitigation strategies.
For example, Tamura et al. (2018) highlight that regions with more significant economic development tend to generate higher emissions due to their intensive industrial activity. This is observed in countries such as China and India, where emissions have increased significantly in recent decades due to accelerated industrial growth. Conversely, states or regions with lower economic development, such as Chiapas and Oaxaca in Mexico or rural regions in Southeast Asia, have considerably lower levels of emissions, highlighting the spatial heterogeneity of the problem (De Jong et al., 2000; Miettinen et al., 2025).
At the international level, research such as Wang et al. (2020) has shown that industrial regions in Europe, particularly those located in Germany and Poland, have high levels of CO₂ emissions, but have also implemented effective strategies to mitigate these impacts through the use of clean technologies. In contrast, in sub-Saharan Africa, emissions are low due to limited industrialization, but environmental vulnerabilities are exacerbated by the lack of adequate infrastructure to adapt to climate change.
Another prominent example is the case of border regions in North America. According to studies by Hsieh et al. (2022), emissions in areas such as Texas and the northern region of Mexico are highly correlated due to geographical proximity and intense trade relations. These spatial interactions underscore the need to design policies that transcend administrative borders and promote international cooperation.
Moreover, recent research has explored how spatial effects on emissions vary within the same country. For example, in Brazil, studies by Silva et al. (2021) identified that Amazon regions, despite having low direct emissions, are affected by industrial activities in nearby regions, such as mining and deforestation, highlighting the negative externalities of economic activity.
The literature has also shown how urban development and transportation policies impact CO₂ emissions. For example, studies by Su et al. (2019) have shown that large metropolises, such as Tokyo and New York, generate significant direct emissions and influence peripheral regions’ carbon footprints due to extended supply chains. This finding underscores the importance of considering spatial interactions when designing emission reduction policies.
Spatial effects on CO₂ emissions reflect the interregional dynamics of economic activity and environmental policies. Understanding these relationships is essential to designing effective mitigation strategies that consider each region’s specific characteristics and promote cross-border collaboration.
2.3. Relationship between economic activity and emissions
The economic literature has widely studied the relationship between economic growth and CO₂ emissions. This link, often described by the Environmental Kuznets Curve (EKC), suggests that emissions initially increase with economic growth but eventually decrease as countries reach a higher level of development and adopt cleaner technologies (Grossman & Krueger, 1995). However, this behavior is not uniform and depends on specific factors such as energy intensity, sectoral composition, and environmental policies.
According to Piaggio et al. (2017), Gross Domestic Product (GDP) growth is often accompanied by increased emissions, particularly in economies dependent on fossil energy sources. This relationship is more evident in developing countries, where access to clean technologies is limited, and energy infrastructure is designed to meet growing demand quickly and cheaply. For example, in countries such as India and South Africa, industrial growth has contributed significantly to rising CO₂ emissions in recent decades (Wang et al., 2020).
Countries such as Sweden and Germany have reduced their absolute CO₂ emissions while maintaining sustained economic growth, demonstrating the potential of sustainability strategies. However, even in these cases, the energy transition faces costs and social acceptance challenges.
In the case of Mexico, Andersson & Karpestam (2013) identified that energy intensity and sectoral composition are critical determinants of emissions. States with a higher dependence on manufacturing, mining, and transportation sectors present higher emissions levels, while those with economies based on agriculture, tourism, and services tend to generate less CO₂. For example, states such as Nuevo León and the Estado de México concentrate a large part of the country’s industrial activity and, consequently, lead GHG emissions (INECC, 2024).
The literature also highlights that urban development policies significantly impact emissions. According to a study by Su et al. (2019), large cities with efficient public transport infrastructure, such as Tokyo and Singapore, have managed to reduce per capita emissions, while urban areas dependent on private transport, such as growing cities in Latin America, show opposite trends.
On the other hand, recent research has explored the impact of globalization on the relationship between economic growth and emissions. Xu & Hisano (2024) point out that international trade flows have shifted emissions from developed countries to developing countries, where production costs are lower but environmental standards are more lax. This phenomenon, known as “carbon leakage,” underscores the need for globally coordinated policies.
A systematic literature review by Tamura et al. (2020) summarizes this relationship’s main factors, highlighting the importance of public policies, economic structure, and consumer preferences. These authors conclude that implementing carbon pricing policies, such as emissions taxes and carbon markets, has positively impacted reducing emissions in advanced economies. However, their application in developing countries remains limited due to economic competitiveness and social equity concerns.
Below, table 1 presents a summary of some prominent studies that discuss the relationship between economic activity and carbon dioxide emissions:
Table 1. Studies on the relationship between economic activity and CO2 emissions.
|
Authors |
Country/Region |
Key Findings |
|
Piaggio et al. (2017) |
Latin America |
Latin America’s GDP growth correlated with higher emissions and dependence on fossil fuels. |
|
Fosten (2019) |
Advanced economies |
Partial decoupling between economic growth and emissions thanks to clean energy. |
|
Su et al. (2019). |
Global cities |
Public transport infrastructure is a key to reducing per capita emissions. |
|
Andersson & Karpestam (2013) |
Mexico |
Energy-intensive industrial sectors are the main emitters in key states. |
|
Xu & Hisano (2024). |
Global |
The carbon leakage phenomenon in developing countries is due to globalization. |
|
Tamura et al. (2020) |
Global |
Global Efficiency of carbon pricing policies in advanced economies versus challenges in developing countries. |
Source: own elaboration.
The relationship between economic growth and CO₂ emissions depends on multiple factors, including the stage of economic development, the sectoral structure, and the public policies implemented. This analysis highlights the importance of adopting differentiated and contextually relevant strategies to mitigate emissions in diverse economies such as Mexico, where economic and geographic heterogeneity presents challenges and opportunities for the transition to sustainability.
2.4. SEM (Spatial Error Model) models
The Spatial Error Model (SEM) is a fundamental tool in spatial econometrics that addresses spatial autocorrelation in econometric model errors. According to Anselin & Hudak (1992), this model is especially useful when the spatial dependence is found in the error terms and not in the explanatory variables, which makes it ideal for studies where the underlying relationships are not fully observable.
The equation defines the SEM:
Y = Xβ + ε
The error equation:
ε = λWε + ξ
Where:
- Y: Dependent variable (in this case, CO₂ emissions).
- X: Matrix of explanatory variables (GDP and population).
- β: Model coefficients.
- ε: Spatial error term.
- λ: Spatial autocorrelation coefficient.
- W: Spatial weight matrix.
- ξ: Independent error term.
Fan et al. (2016) argue that the SEM is particularly relevant in analyses where the data present an intrinsic spatial structure, as in the case of Mexico, where economic and environmental dynamics are deeply interconnected. This model allows for the identification of spatial patterns and improves the precision of estimates by correcting autocorrelation effects that can bias the results.
2.5. Recent advances in spatial econometrics
In recent years, spatial econometrics has seen significant advances that have expanded its applicability and accuracy in analyzing complex geographic phenomena. One of the main innovations has been integrating hybrid methods that combine traditional models, such as the Spatial Error Model (SEM), with big data and machine learning tools. Zhang et al. (2021) highlight how these techniques allow handling large volumes of georeferenced data and detecting spatial patterns with greater precision, which has been particularly useful in greenhouse gas (GHG) emission studies.
Furthermore, access to remote sensing and sensor data has transformed the applications of spatial econometrics, facilitating the analysis of environmental and socioeconomic variables with finer spatial resolutions. For example, Tamura et al. (2018) document how using satellite images has made it possible to identify spatial inequalities in the distribution of CO₂ emissions and critical areas for implementing environmental policies. This approach has improved the understanding of the interactions between economic activity, land use, and emissions, strengthening the empirical evidence needed to design effective interventions.
At the national level, spatial models in Mexico have advanced thanks to the availability of geospatial files provided by institutions such as INEGI, which regularly publishes updated shapefiles with sociodemographic, economic, and environmental information. This accessibility has democratized spatial econometrics, allowing more researchers and analysts to incorporate advanced techniques in their studies. Additionally, developing specialized software such as R, Python, and GeoDa has simplified the implementation of spatial models through packages and libraries that automate the creation of spatial weight matrices, parameter estimates, and diagnostic tests.
Another important advance is the growing recognition by statistical institutions of the need to generate data compatible with spatial analysis. In countries such as Spain, Canada, and Mexico, statistical offices have begun to offer databases designed for spatial studies, including unique geographic identifiers and data in formats that facilitate their integration with specialized software.
Recent findings in the literature also underline the transformative impact of spatial econometrics in public policy. For example, Xu & Hisano (2024) show how spatial models have been instrumental in assessing the effectiveness of environmental policies in interconnected regions, highlighting the importance of considering spatial externalities in decision-making. Similarly, Moutinho et al. (2017) point out that spatial models have made it possible to prioritize critical regions for emissions mitigation and sustainable economic development, optimizing the resources allocated to these purposes.
Advances in spatial econometrics have significantly improved the ability to analyze complex spatial phenomena. The integration of hybrid methods, the availability of high-quality georeferenced data, and the ease of use of software tools have boosted its application in diverse fields, from environmental sciences to regional economics. These developments underscore the importance of investing in analytical capabilities and spatial data generation, ensuring that future studies can address global challenges with a more rigorous and multidimensional approach.
3. METHODOLOGY
3.1. Methodological approaches
This study uses a spatial econometrics approach to analyze the relationship between carbon dioxide (CO₂) emissions, economic activity, and state population in Mexico. Spatial econometrics allows for considering geographic dependencies and spatial effects that may arise between the regions analyzed. This is particularly relevant in CO₂ emissions, where economic and demographic factors may present significant spatial patterns.
The Spatial Error Model (SEM) was selected due to the dataset’s characteristics: the state-level unit of analysis (32 observations) and the need to capture residual spatial dependence between states. The SEM is particularly suited to handle cases where model errors present spatial autocorrelation, allowing for a more precise fit and better interpretation of spatial effects.
3.2. Data and sources
The data used come from official sources and were selected for their relevance to the analysis:
- CO₂ emissions (2022): Calculated based on the energy consumption reported by the Ministry of Energy (SENER, for its acronym in Spanish) and the emission factor provided by the RENE calculator (https://www.gob.mx/inecc/acciones-y-programas/registro-nacional-de-emisiones-rene-17015).
- State Gross Domestic Product (GDP, 2022) Obtained from the National Institute of Statistics and Geography (INEGI).
- State population (2022): Reported by the National Population Council (CONAPO).
- Spatial data: Extracted from the Geostatistical Framework of the 2020 Population and Housing Census shapefile, published by INEGI.
The integration of economic and demographic data with spatial information was carried out using the standard geographic key (NOMGEO). Subsequently, a spatial neighborhood matrix was generated using the Queen Contiguity criterion with the spdep library in R, allowing modeling of spatial interactions between neighboring states.
3.3. Econometric model
The econometric model used in this study is the Spatial Error Model (SEM), which is specified as:
Yᵢ = β₀ + β₁X₁ᵢ + β₂X₂ᵢ + εᵢ
εᵢ = λΣⱼWᵢⱼεⱼ + ξᵢ
Where:
- Yᵢ: CO₂ emissions in state i.
- X₁ᵢ: Gross State Domestic Product (GDP) of state i.
- X₂ᵢ: Population of state i.
- β₀, β₁, β₂: Coefficients of the model to be estimated.
- εᵢ: Spatial error term.
- λ: Spatial autocorrelation coefficient.
- Wᵢⱼ: Elements of the spatial weight matrix, indicating the connection between states i and j.
- ξᵢ: Independent random error term.
The SEM was selected because it captures the spatial autocorrelation present in the errors, common in spatial data analysis at the state level. This allows for the adjustment of the effects of spatial dependence that could bias the results in a traditional model, achieving a more accurate representation of the underlying relationships in the data.
The SEM model is based on the following assumptions:
- There is spatial dependence between observations, i.e., emissions in one state are influenced by emissions in neighboring states.
- The spatial weight matrix W adequately represents the dependence structure between states.
- The errors ξᵢ are independent and normally distributed with zero mean and constant variance.
Based on previous literature, the following signs are expected for the coefficients:
- β₁ > 0: An increase in state GDP is associated with an increase in CO₂ emissions, due to increased economic and industrial activity.
- β₂ > 0: An increase in state population increases pressure on natural resources and energy consumption, resulting in higher emissions.
- λ > 0: Positive autocorrelation suggests that emissions in a state are influenced by emissions in neighboring states.
This model was implemented using R software, employing specialized packages such as ‘spdep’ and ‘sf’ for the creation of ‘he spatial weight matrix and the estimation of the parameters. The model fit and the results obtained will be analyzed in the subsequent sections.
4. RESULTS
The relationship between CO₂ emissions, Gross State Domestic Product (GSDP), and state population in Mexico shows strong spatial heterogeneity. The findings indicate that both economic activity and demographics significantly influence emissions, and these patterns vary according to the socioeconomic and geographic characteristics of each federal state. The results derived from the analysis are presented below.
4.1. Spatial distribution of GSDP and emissions
The exploratory analysis of the data reflects the relationship between economic activity and CO₂ emissions. The 2022 GSDP Map (figure 1) shows a significant concentration of economic activity in the center and north of the country, with Mexico City, Nuevo León, and Jalisco as the most prominent states. These regions represent the main economic hubs in Mexico and are often associated with higher emissions generation due to their high industrial activity. In contrast, southern states such as Chiapas and Oaxaca record the lowest levels of GSDP, reflecting lower industrialization and, consequently, a reduced contribution to CO₂ emissions.
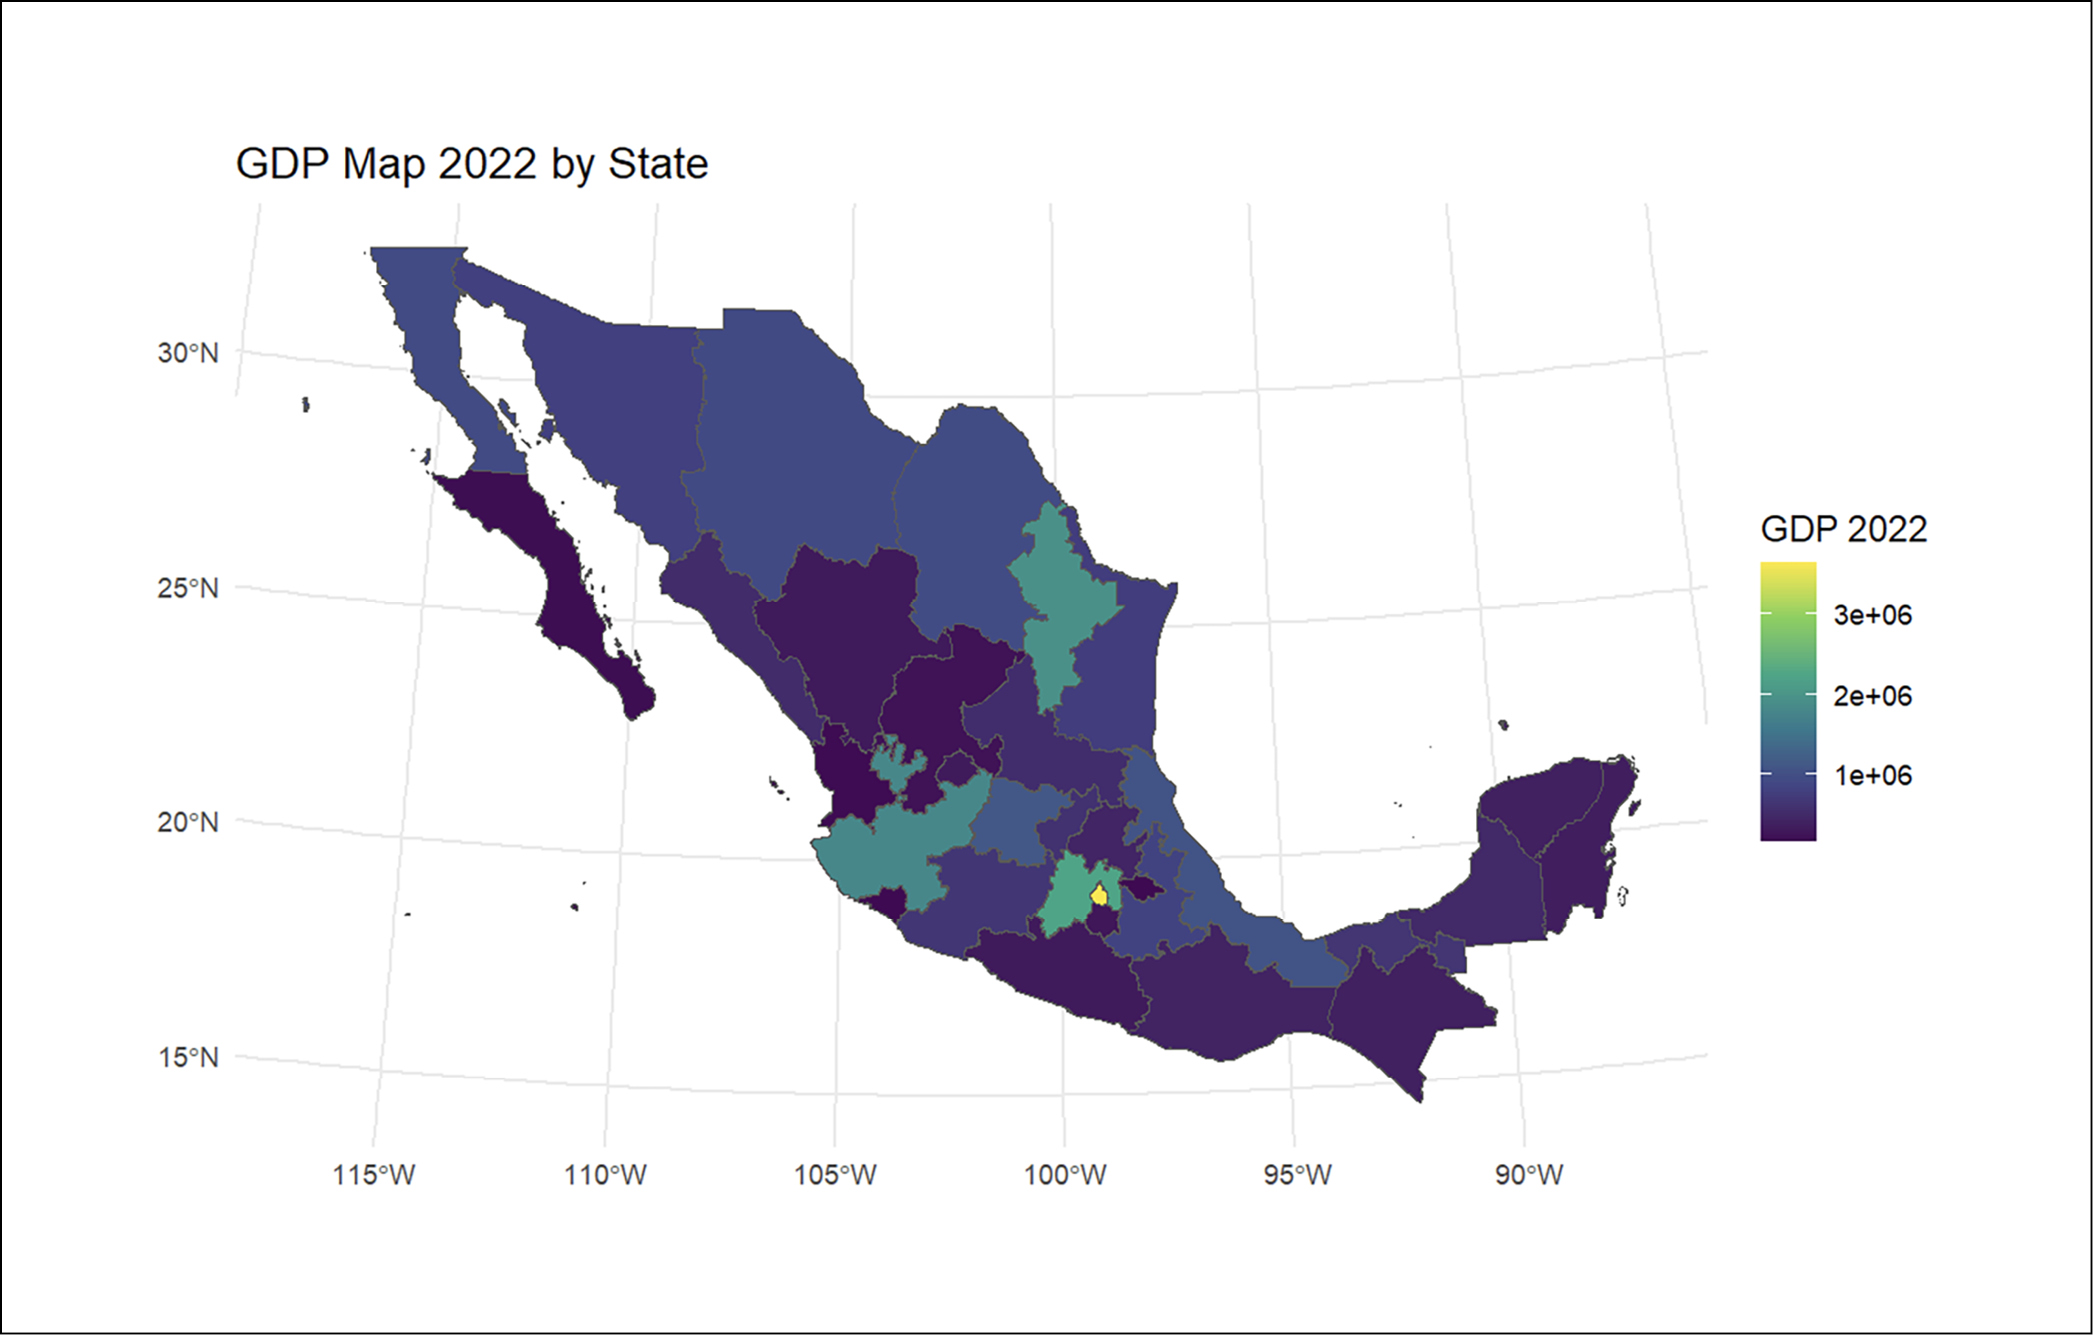
Figure 1. Map of GSDP 2022 by state. Source: own elaboration with data from INEGI.
The CO₂ emissions quartile map (figure 2) complements this perspective by showing the heterogeneous distribution of emissions. The industrialized states of the center-north, such as Nuevo León and Estado de México, are in the highest emissions quartiles, while the predominantly rural states of the south, such as Chiapas and Guerrero, are located in the lowest quartiles. This pattern underlines the influence of economic sectors in the generation of emissions.

Figure 2. Emissions quartile map 2022. Source: own elaboration with data from SENER.
4.2. Spatial statistics and local clusters
The global analysis of the Moran’s I statistic for CO₂ emissions did not reveal a significant spatial autocorrelation (I = -0.068, p =0.61), indicating that, on average, there are no consistent spatial patterns at the national level. However, the LISA Map (figure 3) allows the identification of local clusters with high concentrations of emissions in specific regions. Clusters in the north and center of the country stand out, such as Nuevo León and Mexico City, where intense economic activity and geographic proximity generate specific spatial patterns. These clusters confirm the importance of analyzing local relationships beyond global averages.
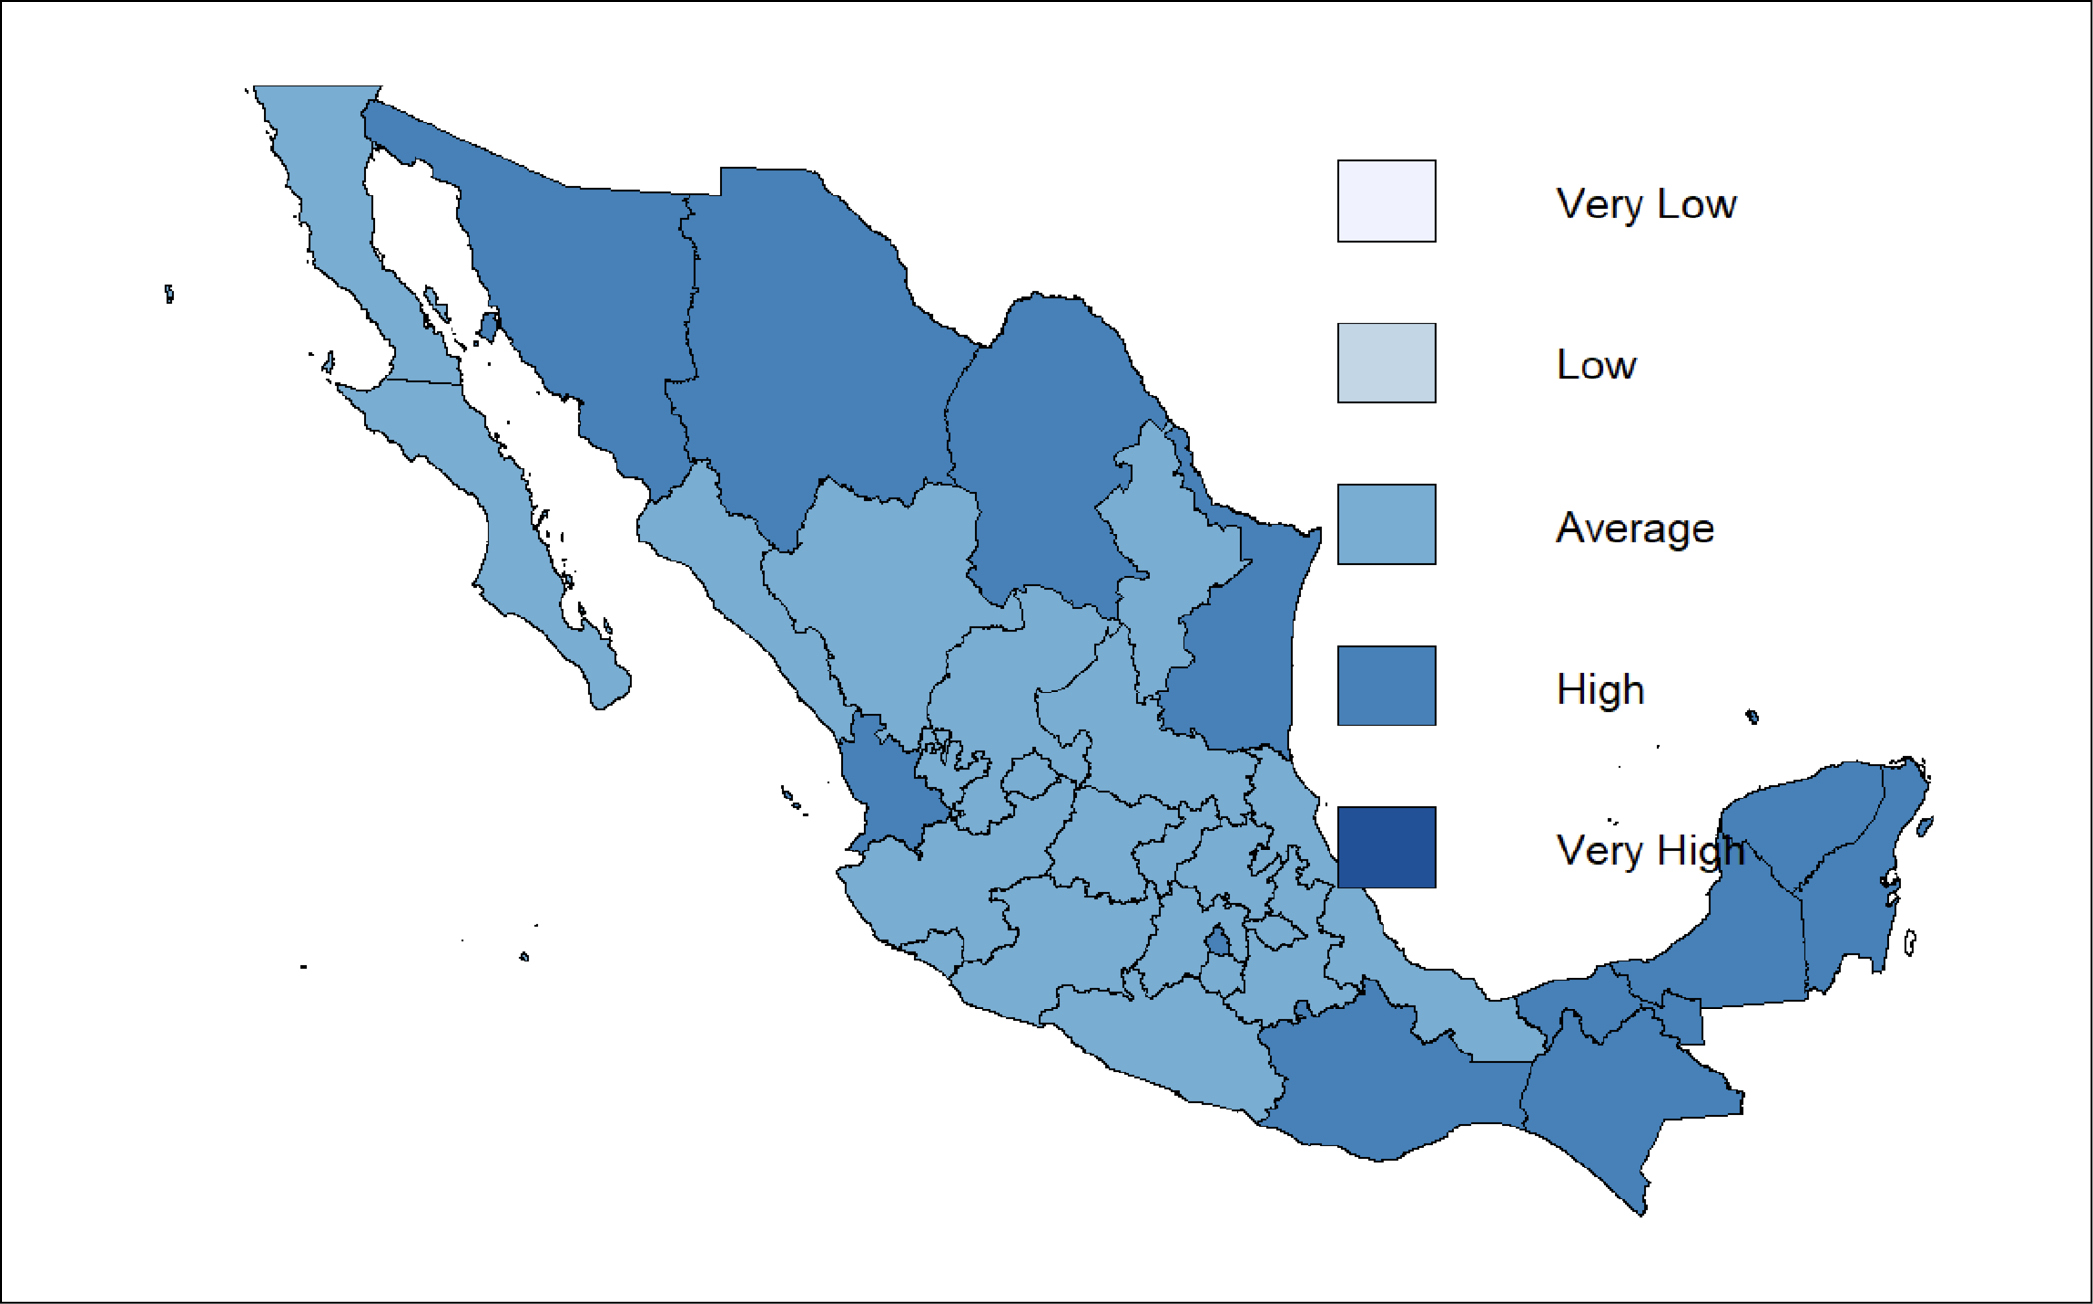
Figure 3. LISA Map for Emissions 2022. Source: own elaboration with data from SENER.
4.3. Model Residual Analysis
The SEM model residual map (figure 4) assesses the accuracy of the model by identifying differences between observed and predicted values. Significant positive residuals were observed in states such as Nuevo León, suggesting that the model underestimates emissions in these highly industrialized regions. On the other hand, southern states such as Chiapas present negative residuals, indicating an overestimation of emissions in areas with lower economic activity. These results suggest that additional variables could improve the model fit, especially in regions with greater discrepancies.
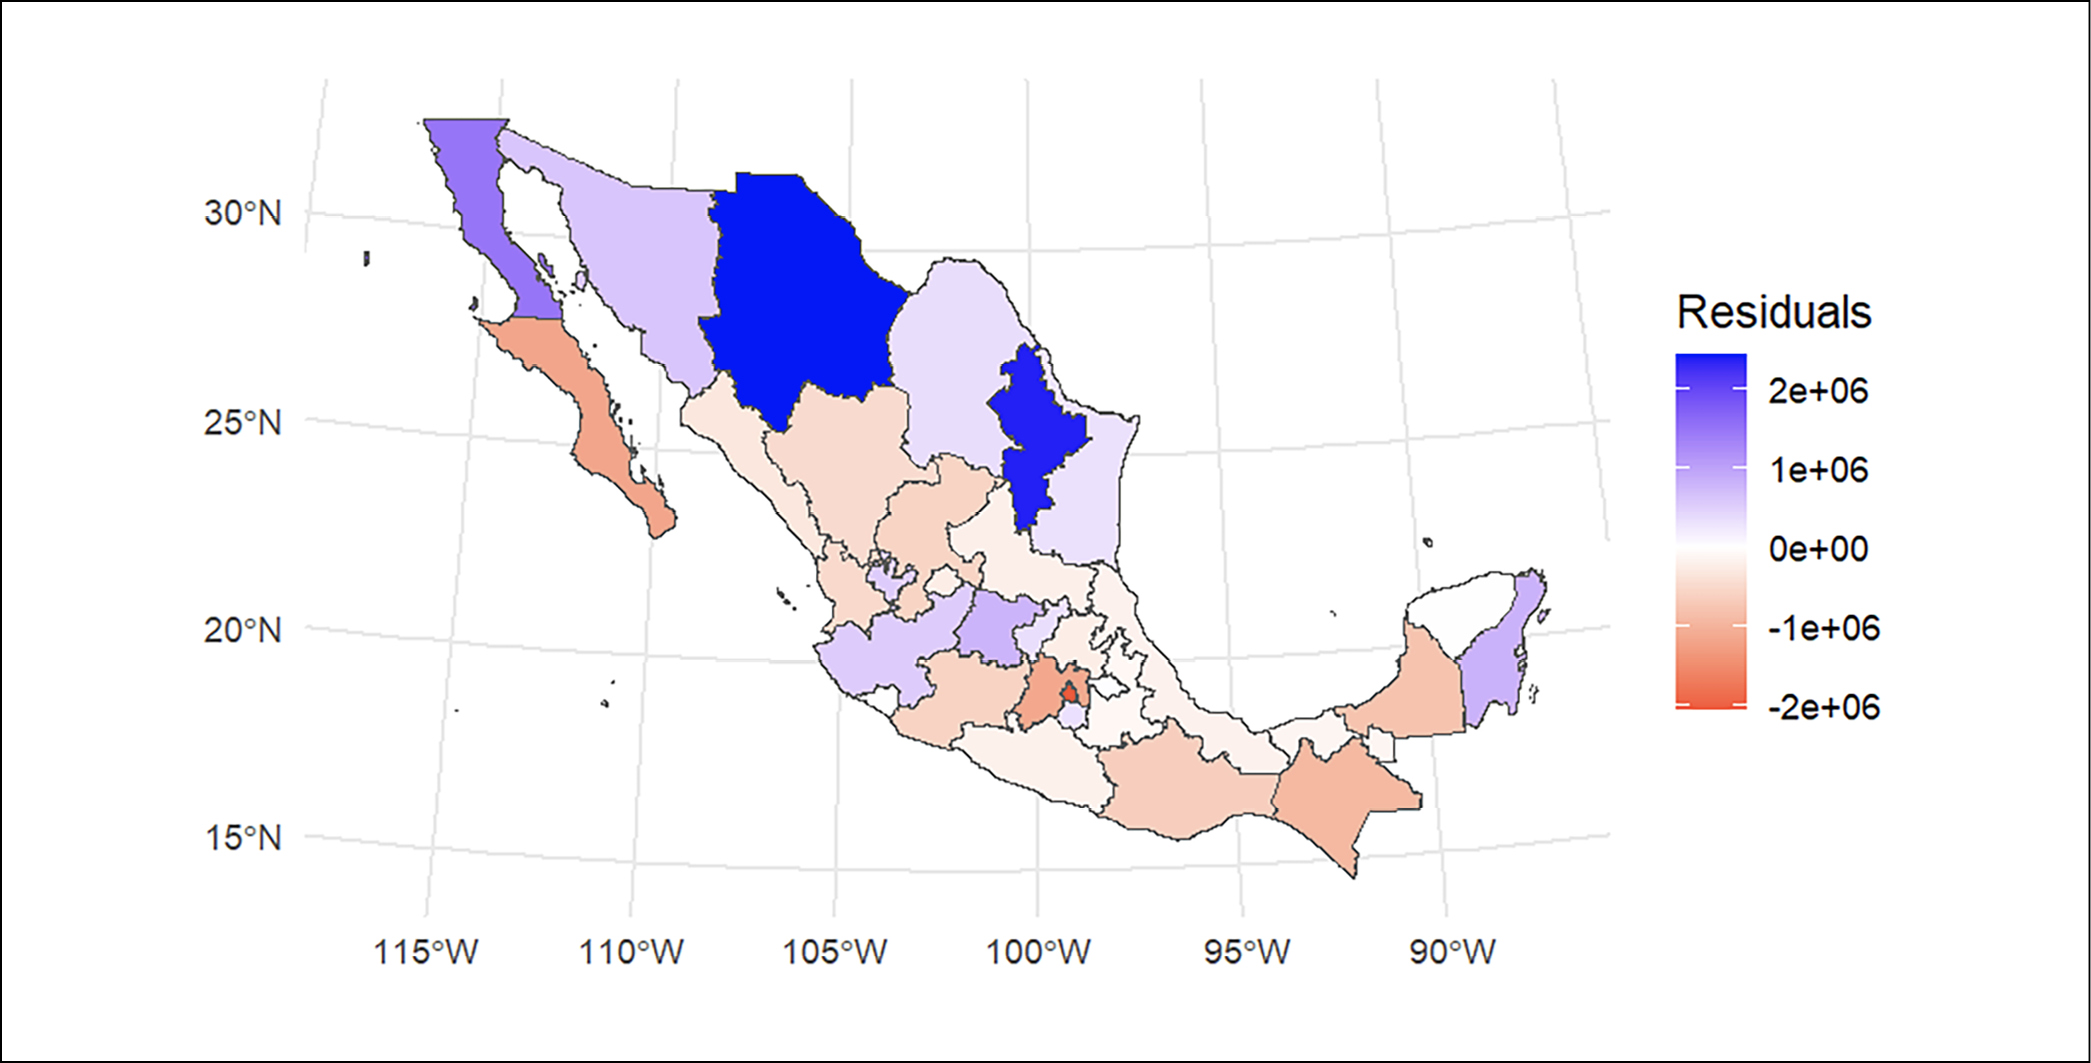
Figure 4. SEM model residual map. Source: own elaboration with data from the results of the spatial analysis.
4.4. Spatial correlation between GDP and CO₂ emissions
The spatial correlation map (figure 5) shows that states with greater economic activity tend to record higher emissions, evidencing a significant positive spatial correlation. The northern and central regions, such as Nuevo León and Mexico City, show a strong correlation between GDP and emissions. In contrast, the southern areas show a weak correlation, reflecting the limited contribution of these states to the national total of emissions.

Figure 5. Spatial correlation map: GDP and Emissions 2022. Source: own elaboration with data from the results of the spatial analysis.
4.5. Econometric analysis and interpretation of the coefficients
The results of the SEM, presented in table 2, highlight the importance of the selected explanatory variables. The coefficients associated with GDP (β₁ = 1.145, p < 0.001) and Population (β₂ = 0.322, p < 0.001) were positive and statistically significant, indicating that an increase in these variables translates into higher CO₂ emissions. This confirms that economic activity and population are the main drivers of emissions in Mexico. The coefficient associated with GDP suggests that states with more dynamic economies tend to generate higher emissions, while the population coefficient reflects that states with higher population density also contribute significantly, although to a lesser extent than GDP.
Table 2. Spatial Error Model (SEM) results.
|
Variable |
Coefficient |
Standard error |
Z-value |
P-value |
|
Intercept |
533580 |
423910 |
1.259 |
0.208 |
|
GDP2022 |
1.145 |
0.330 |
3.469 |
0.0005 |
|
Population2022 |
0.322 |
0.071 |
4.544 |
<0.0001 |
|
Lambda (λ) |
0.593 |
0.155 |
3.828 |
<0.0001 |
Source: own elaboration with data from the results of the spatial analysis.
The spatial parameter (λ = 0.593, p < 0.001) confirms the presence of significant spatial effects, reflecting that emissions in one state are influenced by emissions in neighboring states. This finding supports the importance of incorporating spatial structure in econometric models to avoid bias in estimation and improve the accuracy of analysis.
These results emphasize the need to consider regional strategies to address emissions, given that policies in one state can have indirect effects on neighboring states. This integrated approach is crucial to developing effective environmental policies in a context of economic and geographic interdependence.
This analysis highlights how economic activity and population are the main drivers of CO₂ emissions in Mexico. Furthermore, the incorporation of spatial effects provides a more detailed understanding of the emission patterns, allowing a more integrated approach to the design of public policies focused on environmental sustainability.
5. DISCUSSION
The results obtained in this study highlight the relevance of considering the economic and spatial dimensions to understand CO₂ emissions at the state level in Mexico. In particular, the findings of the SEM model reinforce the idea that economic activity and population are key factors in the generation of emissions, aligning with previous studies such as those by Piaggio et al. (2017) and Fosten (2019), who identified a positive and significant relationship between economic growth and emissions in similar contexts. However, by incorporating spatial effects, a more comprehensive understanding is achieved, highlighting the influence of neighboring states on emission levels.
5.1. Relationship between economic activity, population and emissions
The positive and significant relationship between Gross State Domestic Product (GSDP) and CO₂ emissions confirms that states with higher levels of economic activity tend to generate more emissions, due to their high dependence on energy-intensive sectors, such as manufacturing and transportation. This finding is consistent with previous research (Andersson & Karpestam, 2013; Tamura et al., 2018) that highlights how industrialization amplifies regional disparities in emissions.
On the other hand, the coefficient associated with population reflects that states with higher population density also contribute significantly to emissions. This result is especially relevant in a country like Mexico, where urbanization and population concentration in metropolitan areas intensify the demand for energy and transportation. However, the lower relative weight of population compared to GSDP suggests that economic activity remains the main driver of emissions, highlighting the need for specific policies to reduce carbon intensity in key sectors.
5.2. Importance of spatial effects
The spatial parameter (λ = 0.593, p < 0.001) shows a strong spatial autocorrelation in CO₂ emissions, indicating that environmental policies designed at the state level have implications beyond their borders. This finding is consistent with studies such as Zhang et al. (2021) and Xu & Hisano (2024), which highlight the interdependent nature of emissions in regional contexts. In this sense, the LISA analysis identifies local clusters of high emissions concentration, such as Nuevo León and Mexico City, which require a coordinated approach to address the associated environmental and economic impacts.
On the other hand, the model residuals show discrepancies in states such as Chiapas and Nuevo León, suggesting that omitted variables, such as the type of energy matrix or the intensity of land use, could improve the model fit. These results underline the importance of expanding the analysis to include additional factors that influence emissions, particularly in regions with high levels of industrialization or economic vulnerability.
5.3. Practical and theoretical implications
From a practical perspective, this study offers analytical tools for the design of public policies that consider spatial heterogeneity and interdependencies. The findings suggest that mitigation strategies should focus on key economic sectors and priority regions, such as the industrial clusters in the north and center of the country, where emissions are significantly higher. In addition, it is essential to implement measures that foster regional cooperation, given that isolated policies can have indirect effects on neighboring states.
On a theoretical level, this study contributes to the growing body of literature that integrates spatial econometrics in the analysis of GHG emissions. By applying a SEM model, the relevance of capturing spatial effects is demonstrated to avoid biases in the estimation and improve the accuracy of the analysis. This opens the door for future studies exploring more complex dynamics, such as the relationship between investments in renewable energy and emissions patterns at the regional level.
5.4. Limitations and recommendations
Although the results are robust, there are inherent limitations to the analysis that should be considered. First, the use of cross-sectional data limits the ability to capture temporal dynamics in the relationship between economic growth and emissions. Future studies could incorporate longitudinal analyses to identify trends and assess the impact of policies implemented in different periods. Second, relevant variables such as the energy matrix, land use intensity or transport quality were not included in this model, which could influence the observed patterns.
Finally, the reliance on aggregate data at the state level does not allow capturing intraregional disparities in emissions, which could underestimate heterogeneity within states. It is therefore recommended to expand the analysis to sub-state levels, incorporating data at the municipal or metropolitan level, to obtain a more granular view of emission patterns.
6. CONCLUSIONS
This study has allowed us to analyze carbon dioxide (CO₂) emissions in Mexico from a spatial perspective, relating them to economic activity and state’s population. This approach has shown the relevance of spatial dynamics in the generation of emissions, highlighting the need to incorporate advanced analytical tools, such as spatial econometric models, to understand complex phenomena and their geographic distribution.
The findings underline that states with higher levels of Gross State Domestic Product (GSDP) and population tend to generate more CO₂ emissions, confirming the hypothesis raised. In particular, the coefficient associated with GSDP (β₁ = 1.145, p < 0.001) shows that economic activity is the main driver of emissions in Mexico. This result is consistent with the existing literature, which points to a positive correlation between economic growth and emissions in developing contexts. However, it also highlights the urgent need to move towards less carbon-intensive economic models, a significant challenge in a country where energy generation and industry still rely heavily on fossil fuels.
Meanwhile, the population coefficient (β₂ = 0.322, p < 0.001) reflects that states with higher population density also contribute significantly to emissions. This highlights the pressure that population concentration exerts on transport systems and energy infrastructure, especially in metropolitan areas. However, the lower relative weight of this variable compared to GDP indicates that mitigation policies should focus primarily on key economic sectors.
An innovative aspect of this study is the inclusion of spatial effects through the Spatial Error Model (SEM), which captures spatial autocorrelation in CO₂ emissions. The spatial parameter (λ = 0.593, p < 0.001) shows that emissions in a state are significantly influenced by emissions in neighboring states, a finding that coincides with international studies and reinforces the importance of designing public policies from a regional and coordinated perspective. This result highlights that isolated interventions in a state can generate positive or negative collateral effects in adjacent states, underlining the economic and geographic interdependence that characterizes Mexico.
The spatial analysis, complemented with tools such as Moran’s I statistics and LISA maps, allowed us to identify patterns of local emission clusters. For example, regions such as Nuevo León and Mexico City show a high concentration of emissions due to their intense economic and industrial activity, while areas in the south such as Chiapas present significantly lower values. This regional contrast emphasizes the need to adapt mitigation policies to the specific characteristics of each region, recognizing the heterogeneity of economic development and resource distribution.
Despite the methodological and analytical advances of this study, it is important to recognize its limitations. The use of cross-sectional data restricts the ability to analyze temporal trends in emissions and assess the impact of environmental policies implemented over different periods. Furthermore, key variables such as the energy mix, land use intensity, and transport quality were not considered, which could influence the observed patterns. Future studies could address these limitations by using longitudinal data and incorporating additional variables to enrich the analysis.
From a practical perspective, this study provides valuable inputs for the design of environmental policies in Mexico. The findings highlight the need to foster regional cooperation and prioritize mitigation in key economic sectors, particularly in the high-emission clusters identified in the analysis. In addition, it is suggested to promote investments in clean technologies and energy efficiency, especially in industrialized regions, to reduce carbon intensity without compromising economic growth. These recommendations are essential for Mexico to meet its international commitments under the Paris Agreement and move towards sustainable development.
In conclusion, the relationship between economic activity, population and CO₂ emissions in Mexico reflects a critical challenge in the transition towards a sustainable development model. This study shows that mitigation policies must be comprehensive and regionally adapted, taking advantage of the analytical tools of spatial econometrics to maximize their effectiveness. By integrating spatial considerations into the design of environmental strategies, we can move towards a more equitable and resilient future, where economic growth is not in conflict with environmental sustainability.
Acknowledgments and funding
This research was conducted as part of the project “Perspectiva dinámica de la evolución de la curva ambiental de Kuznets en Ecuador y México”, registered with the Dirección General de Investigación y Posgrado (DGIP) of the Universidad Autónoma de Sinaloa (UAS). The authors acknowledge the institutional support provided by UAS. However, this research did not receive any funding.
Responsibilities and conflicts of interests
The author declares that there are no conflicts of interest related to the publication of this article. If any conflict arises in the future, it will be disclosed accordingly.
REFERENCES
Andersson, F. N. G., & Karpestam, P. (2013). The environmental Kuznets curve: Determinants of the CO₂ intensity of economies in the OECD: A dynamic panel approach. Ecological Indicators, 34, 206–214. https://doi.org/10.1016/j.ecolind.2013.04.003
Anselin, L. (2013). Spatial econometrics: Methods and models. Springer. https://doi.org/10.1007/978-94-015-7799-1
Anselin, L., & Hudak, S. (1992). Spatial econometrics in practice: A review of software options. Regional Science and Urban Economics, 22(3), 509–536. https://doi.org/10.1016/0166-0462(92)90042-Y
Bivand, R. S., & Piras, G. (2015). Comparing implementations of estimation methods for spatial econometrics. Journal of Statistical Software, 63(1), 1–36. https://doi.org/10.18637/jss.v063.i18
Bröcker, J., Korzhenevych, A., & Schürmann, C. (2022). The ripple effects of large-scale transport infrastructure investment. Economic Modelling, 91, 559-573.
De Jong, B. H. J., Tipper, R., & Montoya-Gómez, G. (2000). An economic analysis of the potential for carbon sequestration by forests: Evidence from southern Mexico. Ecological Economics, 33(2), 313-327. https://doi.org/10.1016/S0921-8009(99)00162-7
Dong, K., Hochman, G., Zhang, Y., Sun, R., Li, H., & Liao, H. (2018). CO₂ emissions, economic and population growth, and renewable energy: Empirical evidence across regions. Energy Economics, 75, 180-192. https://doi.org/10.1016/j.eneco.2018.08.017
El País (2025, February 21). La economía de México creció 1.2% en 2024, su peor desempeño desde 2020. https://elpais.com/mexico/2025-02-21/la-economia-de-mexico-crecio-12-en-2024-su-peor-desempeno-desde-2020.html
Emission Index (2021). Greenhouse Gas Emissions in Mexico. https://www.emission-index.com/countries/mexico
European Environment Agency (2023). Total net greenhouse gas emission trends and projections in Europe. https://www.eea.europa.eu/en/analysis/indicators/total-greenhouse-gas-emission-trends
Fan, J., Li, R., & Wang, Y. (2016). Exploring spatial interactions: A spatial error model approach. Regional Science and Urban Economics, 59, 89–102. https://doi.org/10.1016/j.regsciurbeco.2016.04.002
Fosten, J. (2019). Economic growth and CO₂ emissions: Disentangling the role of energy consumption. Energy Economics, 84, 104548. https://doi.org/10.1016/j.eneco.2019.104548
Friedlingstein, P., Jones, M. W., O’Sullivan, M., Andrew, R. M., Bakker, D. C. E., Hauck, J., ... & Le Quéré, C. (2022). Global Carbon Budget 2021. Earth System Science Data, 14(4), 1917-2005. https://doi.org/10.5194/essd-14-1917-20
Global Carbon Project. (2021). Global carbon budget 2021. https://www.globalcarbonproject.org
Gobierno de México (2020). Actualización de la Contribución Determinada a Nivel Nacional de México. Secretaría de Medio Ambiente y Recursos Naturales (SEMARNAT). https://www.gob.mx/cms/uploads/attachment/file/600510/NDC_Actualizada2020.pdf
Grossman, G.M., & Krueger, A.B. (1995) Econmic Growth and the Environment. The Quarterly Journal of Economics, 110(2), 353–377, https://doi.org/10.2307/2118443
Hsieh, C. H., Wu, S. C., & Chen, Y. J. (2022). Cross-border carbon emissions and economic activity in North America. Environmental Economics and Policy Studies, 24(3), 189–205. https://doi.org/10.1007/s10018-022-00312-4
Instituto Nacional de Ecología y Cambio Climático (INECC). (2021). Inventario Nacional de Emisiones de Gases y Compuestos de Efecto Invernadero. INECC.
Instituto Nacional de Ecología y Cambio Climático (INECC) (2024). Análisis de los sectores productivos con mayor emisión de gases y compuestos de efecto invernadero. Secretaría de Medio Ambiente y Recursos Naturales. https://www.gob.mx/cms/uploads/attachment/file/921220/03_2024_EmisionesPorSectoresEcon_micos_290524.pdf
Instituto Nacional de Ecología y Cambio Climático. (2022). Inventario Nacional de Emisiones de Gases y Compuestos de Efecto Invernadero 2021. INECC. https://www.gob.mx/inecc
International Energy Agency (IEA) (2021). Germany 2021 Energy Policy Review. https://www.iea.org/reports/germany-2021
International Energy Agency (IEA). (2021). Nordic Energy Research: Sweden’s Path to Fossil-Free Energy. https://www.iea.org/reports/nordic-energy-research
LeSage, J.P., & Pace, R.K. (2009). Introduction to spatial econometrics. CRC Press. https://doi.org/10.1201/9781420064254
López-Rodríguez, J., & Faiña, J.A. (2020). Regional spillovers of transport infrastructure investment: A territorial cohesion analysis. Regional Studies, 54(5), 684-696. https://doi.org/10.1080/00343404.2020.1711875
Miettinen, J., Shi, C., & Liew, S.C. (2025). Land cover distribution in the peatlands of Peninsular Malaysia, Sumatra and Borneo in 2015 with changes since 1990. Global Ecology and Conservation, 9, 67-78. https://doi.org/10.1016/j.gecco.2016.02.004
Moutinho, V., Madaleno, M., & Robaina, M. (2017). Economic and energy efficiency indicators as a means to improve CO₂ emissions. Sustainability, 9(11), 1967. https://doi.org/10.3390/su9111967
Piaggio, M., Padilla, A., & López, F. (2017). Environmental Kuznets curve: A review of empirical literature. Ecological Economics, 132, 145–157. https://doi.org/10.1016/j.ecolecon.2017.05.002
Shahbaz, M., Lean, H.H., & Shabbir, M.S. (2013). Environmental Kuznets curve hypothesis in Pakistan: Cointegration and Granger causality. Renewable and Sustainable Energy Reviews, 25, 166-178. https://doi.org/10.1016/j.rser.2013.04.034
Silva, J.E., Santos, P.H., & Lima, R.M. (2021). Deforestation and emissions in the Amazon: Evidence from satellite data. Remote Sensing, 13(4), 721. https://doi.org/10.3390/rs13040721
Stern, D.I. (2004). The rise and fall of the environmental Kuznets curve. World Development, 32(8), 1419-1439. https://doi.org/10.1016/j.worlddev.2004.03.004
Su, Y., Li, Z., & Yang, M. (2019). Urban transportation policies and their effect on CO₂ emissions: A comparative study. Transportation Research Part D: Transport and Environment, 75, 147–160. https://doi.org/10.1016/j.trd.2019.09.013
Tamura, K., Yoshida, S., & Ohta, N. (2018). Spatial patterns of CO₂ emissions in industrial regions. Journal of Cleaner Production, 256, 120567. https://doi.org/10.1016/j.jclepro.2020.120567
Tamura, T., Suganuma, M., & Nakamura, K. (2020). Industrialization and carbon emissions in developing economies. Environmental Science & Policy, 85, 80–90. https://doi.org/10.1016/j.envsci.2018.03.021
Trading Economics (2022). Mexico CO₂ Emissions. Retrieved from https://tradingeconomics.com/mexico/co2-emissions
United Nations Framework Convention on Climate Change (UNFCCC) (2015). The Paris Agreement. https://unfccc.int/process-and-meetings/the-paris-agreement/the-paris-agreement
Wang, X., Zhao, X., & Chen, H. (2020). Industrial CO₂ emissions in emerging economies: A case study of India and South Africa. Energy Policy, 140, 111398. https://doi.org/10.1016/j.enpol.2020.111398
Xu, B., & Hisano, K. (2024). Spatial interaction effects in global carbon emission policies. Global Environmental Change, 75, 102604. https://doi.org/10.1016/j.gloenvcha.2024.102604
You, W., Zhu, H., & Yu, K. (2023). Regional disparities in carbon emissions and economic growth: Evidence from a spatial econometric approach. Journal of Cleaner Production, 389, 136018. https://doi.org/10.1016/j.jclepro.2023.136018
You, W., Zhu, H., & Yu, K. (2023). Regional disparities in carbon emissions and economic growth: Evidence from a spatial econometric approach. Journal of Cleaner Production, 389, 136018. https://doi.org/10.1016/j.jclepro.2023.136018
Zhang, D., & Broadstock, D.C. (2020). The causality between economic growth and emissions: A regional approach. Applied Energy, 264, 114687. https://doi.org/10.1016/j.apenergy.2020.114687
Zhang, W., Li, Y., & Huang, J. (2021). Spatial disparities and carbon emissions: A global perspective. Environmental Research, 199, 111233. https://doi.org/10.1016/j.envres.2021.111233
Zhao, X., Liu, C., & Tan, J. (2022). Spatial spillover effects of carbon emissions and economic growth in China: A spatial econometric analysis. Energy Economics, 112, 106183. https://doi.org/10.1016/j.eneco.2022.106183