
DOI: https://dx.doi.org/10.12795/rea.2021.i42.06
Formato de cita / Citation: Ciacci, A. & Traversa, S. (2021). A non-compensatory time analysis of material deprivation in the EU. Revista de Estudios Andaluces, 42, 118-137. https://dx.doi.org/10.12795/rea.2021.i42.06
Correspondencia autores: andrea.ciacci@edu.unige.it (Andrea Ciacci)
 CC BY-NC-ND 4.0
Andrea Ciacci
andrea.ciacci@edu.unige.it  0000-0002-7532-8225
Department of Economics and Business Studies, University of Genoa.
Via Francesco Vivaldi, 5, 16126 Genoa, Italy.
Susanna Traversa
traversa.su@gmail.com
0000-0001-5030-2021
Department of Political Science, University of Genoa.
Piazzale Emanuele Brignole, 2, 16136 Genoa, Italy.
INFO ARTÍCULO
Received: 27-04-2021
Revised: 21-06-2021
Accepted: 22-06-2021
ABSTRACT
The financial and economic crisis that hit Europe since 2009 has highlighted the need to measure more effectively the impact that certain exogenous shocks can have in the social field. In order to fill this gap and to provide a statistical tool useful to measure phenomena evolving over time, we perform a non-compensatory time analysis of material deprivation in Europe by using the quantitative method known as Adjusted Mazziotta and Pareto Index (AMPI). Material deprivation is a proxy to identify the most suffering groups of people in a specific environment. We consider the material deprivation as the sum of economic stress and forced lack of durable goods. Using Eurostat EU-SILC data, we aim at determining which countries have suffered the most material deprivation and identifying clusters of deprivation. We also determine how material deprivation is evolved over time, from 2005 to 2019. Subsequently, through Influence Analysis, the robustness of the index obtained is evaluated. Our results show that the material deprivation gap between Eastern and Mediterranean countries and all the remaining countries, which already existed before the economic crisis, seems to have widened in the years up to 2015.
KEYWORDS
Deprivation
Quantitative method
AMPI
Composite indicator
Europe
RESUMEN
La crisis financiera y económica que golpea a Europa desde 2009 ha puesto de manifiesto la necesidad de medir de forma más eficaz el impacto que pueden tener ciertas perturbaciones exógenas en el ámbito social.
Para llenar este vacío y proporcionar una herramienta estadística útil para medir los fenómenos que evolucionan en el tiempo, realizamos un análisis temporal no compensatorio de la privación material en Europa mediante el método cuantitativo conocido como Índice de Mazziotta y Pareto Ajustado (IAM). La privación material es un indicador para identificar a los grupos de personas que más sufren en un entorno específico. Consideramos que la privación material es la suma del estrés económico y la carencia forzosa de bienes duraderos. Utilizando los datos de Eurostat EU-SILC, pretendemos determinar qué países han sufrido la mayor privación material e identificar grupos de privación. También determinamos cómo evoluciona la privación material a lo largo del tiempo, desde 2005 hasta 2019. Posteriormente, a través del Análisis de Influencia, se evalúa la robustez del índice obtenido. Nuestros resultados muestran que la brecha de privación material entre los países del Este y del Mediterráneo y el resto de países, que ya existía antes de la crisis económica, parece haberse ampliado en los años transcurridos hasta 2015.
PALABRAS CLAVE
Privación
Método cuantitativo
AMPI
Indicador compuesto
Europa
Over the last few decades, the European Union has shown a growing interest in studying the improvement of the living conditions of the EU population. Through the study of the different forms of social exclusion and the construction of tools for quantitative analysis and monitoring of the phenomenon, the EU institutions have committed themselves to define common strategies and objectives, with the aim of identifying public and social policies capable of ensuring the achievement of a more inclusive European community (European Commission, 2010).
Approaching the issue of social exclusion from a theoretical point of view, it is possible to come across a double interpretation of the concept of inequality in the literature, according to which there is a distinction between an economic dimension on the one hand, and a social dimension on the other.
Economic inequality, or income inequality, identifies the unequal and inefficient distribution of income and wealth within a community as the determining cause of an individual’s marginalisation (Gini, 1912; Atkinson, 1970). Considering social inequality, instead, the scope of the definition extends to the factors that determine economic inequality, recognizing the multidimensional character of the phenomenon (Sen, 1999; Ciacci & Tagliafico, 2020). Among the determinants of social exclusion there are, for example, the lack of recognition of fundamental rights and freedoms, the inability to access education at any level, the inefficient provision of health services, the quality of housing, the inability to manage leisure time at will and the inability to access a series of goods and services commonly considered fundamental within the community to which one belongs. From this general definition, some shared characteristics emerge between social inequality and material deprivation, which can have a negative impact on a person’s ability to integrate within the community and are of interest in this work.
Although from a theoretical point of view there is no univocal definition, the literature often tends to adopt the interpretation proposed by Peter Townsend (1979), which highlights the relationship between material deprivation and the forced lack of commonly accessible goods and services within the reference context. Two fundamental requirements are thus identified in order to determine the actual condition of deprivation suffered by an individual: on the one hand, the involuntary lack of possession or the impossibility of fully exploiting a specific set of goods and services (Mack & Lansley, 1985); on the other hand, the subdivision of the population into the two categories of deprived and non-deprived, which emphasizes the state of possible social exclusion to which the former are exposed (Israel & Spannagel, 2019).
In order to clarify the theoretical framework within which our analysis operates, it is necessary to distinguish the semantic sphere of deprivation from that of poverty. In fact, although the two words are often used as synonyms, they refer to two different phenomena. Despite recent advances in the literature (Bruzzi et al., 2020; Ivaldi et al., 2020 a), the inability to establish solid theoretical boundaries does not totally exclude the risk of confusing deprivation and poverty.
In this regard, poverty can be interpreted both in absolute and relative form, and it is the latter meaning that implies a greater ambiguity with the concept of deprivation. As theorized by Townsend (1979), the expression “relative poverty” indicates the condition in which the lack of specific economic resources prevents from supporting a lifestyle widely encouraged and shared within a society. The juxtaposition between deprivation and poverty is often taken up by various authors, through studies aimed at verifying and quantifying the impact of material deprivation – or basic deprivation – on people suffering from relative poverty and economic stress, to allow national and European institutions to intervene with targeted and efficient socio-economic policies (Matković et al., 2007; Whelan & Maître, 2013).
In order to be able to compare and classify countries according to their level of deprivation, the choice fell on a quantitative method of a partially non-compensatory aggregative nature. In this study we propose the use of the method known as Adjusted Mazziotta-Pareto Index – AMPI (Mazziotta & Pareto, 2018; Ivaldi et al., 2020 a), an evolution of the MPI method (Mazziotta & Pareto, 2017; Ivaldi & Ciacci, 2020), adapted to favour the analysis of historical series. We chose the period 2005-2019, given the completeness of the available data and the delicate period due to the economic-financial crisis that occurred during the period and had deep repercussions in the social field (Cuadrado-Roura et al., 2016). The data is drawn from the set provided by Eurostat EU-SILC, a series of data collected annually, which guarantees homogeneity of collection, comparability, and completeness.
The indicators used are subjective in nature, so the deprivation is measured in terms of the deprivation declared or perceived by respondents. The subjective indicators suffer from some criticality. The measurement of subjective characteristics is influenced by factors such as conscience, cognition, emotion, attitude, and opinion – that are related to contingent and mutable situations. Consequently, it is often difficult to identify which specific elements have most influenced the perception of reality expressed by an individual or community (Maggino, 2017 a, b).
Despite these apparent limitations, over the last decades, information derived from subjective well-being has been employed with increased frequency and care in different fields of the social research. Attention focused on two issues: how to measure individual well-being or economic disadvantage, and what factors are associated with it (Diener & Biswas-Diener, 2002; Stiglitz et al., 2009; Brulé & Maggino, 2017). It has been demonstrated that subjective indicators can be a valid alternative to the use of traditional economic indicators (e.g., GDP overrun, see Chaaban et al., 2016; Alaimo & Maggino, 2020; Bianchi & Biffignandi, 2020), since objective indicators alone represent a portion of reality and are therefore not able to provide a complete representation of phenomena characterized by a high degree of complexity (Maggino, 2017 a, b; Ciacci et al., 2020).
Through this analysis we want to provide a picture of the deprivation declared in EU27 countries over the period 2005-2019. In other words, we want to show what trends have emerged during the decade, in a period that includes the economic and financial crisis started in 2009 in Europe. This practice makes it possible not only to identify more or less deprived countries, but also to identify benchmarks and extrapolate ideas on the basis of which European countries could share good practices in the future. It is also possible to observe which countries, following the implementation of certain policies in the economic-social field, have emerged stronger and which, instead, have not benefited. The political implications of the paper are manifold.
Historically, the first studies on deprivation date back to the British experience in the early 1980s. The first proposal for an indicator designed for a European country is represented by the Underprivileged Area Score 8 (UPA-8) designed by Brian Jarman (1983), to support policy makers in the assessment and definition of welfare policies in Great Britain. The 8 indicators are subject to a weighting process, based on the perception of their degree of influence on the workload sustained by GPs during 1984: Unemployment; Overcrowding; Households made up of lonely elderly people; Single parent households; Ethnic minorities; Number of children under the age of 5; Belonging to a lower social class (determined according to the condition of the head of the family); Incoming mobility.
Subsequently, Peter Townsend (1987), commissioned by the Northern Regional Health Authority, developed a deprivation index for the analysis and planning of health policies in the Northern counties of England. Townsend’s index is made up of 4 unweighted indicators (Unemployment; Overcrowding; Proportion of households that do not own their own homes; Proportion of households that do not own cars), selected from census sources and considered by the author as directly capable of determining the presence of deprivation (Townsend, 1987).
The indexes proposed by Jarman and Townsend have a common element if we look at the field of application: the so-called small area (Bartley & Blane, 1994; Carr Hill, Jamison, O’reilly, Stevenson & Reid, 2002). This term refers to the definition of circumscribed geographical areas, generally drawn from electoral districts (Jarman, 1983; Townsend, 1987) or urban units (Ivaldi & Testi, 2011), capable of ensuring a homogeneous application of the index with respect to the socio-cultural and territorial characteristics of the communities examined (Castairs & Morris, 1991; Bruzzi et al., 2020).
However, the use of small areas does present problems. The main critical issues are related to the ecological fallacy, i.e., the risk of falling into a generalist interpretation of the results that leads to bringing the presence of the phenomenon back to the geographical rather than the individual level (Townsend et al., 1988; Lancaster & Green, 2002), and to the modifiable areal unit problem (Openshaw & Taylor, 1981) according to which the artificiality and dynamism of the boundaries of the geographical units usually taken as small areas would limit the possibility of carrying out time analyses of a phenomenon (Norman et al., 2008; Norman, 2010). The interest shown by the European Union towards the social condition of the population has led to a reshaping of the concept of “small area” in recent years, in order to elaborate specific deprivation indexes for the community context; territorial subdivisions have been based on the national borders of the single member states (Fusco et al., 2013) thus limiting the influence of the criticalities previously exposed. It should also be noted that using aggregated indices at a geographical level presupposes that they are a good approximation of the individual economic risk and that there is a “context effect”, i.e., a specific environmental factor that influences the social condition (Macintyre et al., 2002; Bruzzi et al., 2020).
Due to the strong trend among Eastern European countries to join the European project in the 2000s, the Organisation for Economic Cooperation and Development (OECD) proposed in 2004 a further theoretical division of the member states into two macro-groups: the old member states (EU15) and the new member states (EU10). Using this classification, two main trends emerge (Matković et al., 2007; Fura et al., 2017): on the one hand, a condition of greater deprivation shown by the former socialist countries, especially after their entry into the European Union and the transition from a communist-type state system to a capitalist and free market system. This transformation can in fact be considered one of the main elements responsible for the accentuation of the differences between the most disadvantaged social groups and the rest of the population, at the same time limiting the human development of the State compared to the other countries of the Union. On the other hand, the tendency of countries such as Greece, Spain, and Portugal to position themselves globally as the countries with the highest degree of deprivation: this is a factor of discontinuity compared to most of the countries included in the EU15 group, which on average show a state of lower disadvantage at the Community level.
Following the economic and financial crisis of 2008, the European institutions’ attention to the socio-economic conditions of the population peaked in 2010 with the proclamation by the European Council, following a proposal by the European Commission, of the Europe 2020 strategy. Among the five points envisaged within the strategy to tackle the effects of the crisis, the fifth and final point was the improvement of the conditions of poverty and marginalisation afflicting the population. The final goal is to lift at least 25% of the population out of the national poverty risk by 2020, in addition to the creation of a European Platform against poverty and social exclusion.
The main indicators considered by Eurostat to monitor the progress of this goal from a statistical point of view are the risk of poverty, the number of households with very low work intensity and the presence of severe material deprivation (European Commission, 2010). This concept was introduced in the European Union in 2009, following the adoption of two deprivation indices created specifically for the reality of the EU (Guio, 2009), built on the basis of 9 indicators included in the EU-SILC module (Statistics on Income and Living Condition) dedicated to material deprivation and available for consultation in the Eurostat statistical database: if a person suffers from at least 4 of these elements, he or she would be described as severely deprived, i.e. unable to carry out simple activities and/or face current expenses. Of great importance was also the definition, in 2013, of a theoretical framework including techniques for the selection, aggregation and weighing of indicators, which laid the foundations for the identification of a single and shared criterion for the construction of a European material deprivation indicator (Guio, 2009).
Although traditionally studies on deprivation neglect the possibility of retracing its historical evolution, in recent years several authors have proposed a series of innovative techniques for the development of tools that could integrate the temporal dimension. In a study carried out by Norman (2010) the Townsend Index is used to carry out a historical analysis of material deprivation trends in the UK, taking advantage of the accessibility and availability of data from both a temporal and geographical point of view. With this approach Norman wanted to demonstrate the usefulness of an index for a time analysis of material deprivation in public policy making processes. With respect to the traditional indices that do not consider the temporal dimension, the material deprivation results from a condition of long-term disadvantage (Calandrino, 2003). Understanding the evolution of the phenomenon over time would in fact allow policy makers to have more complete and contextualised information on the conditions of the population than in the past when the methodological approach focused on precise analyses of the phenomenon.
In the study proposed by Landi et al. (2018), the authors define a tool capable of retracing the evolution of social exclusion over time. This measure is related to health conditions, in order to understand what impact material deprivation had on the socio-economic equilibrium of the city of Genoa in the period between 1991 and 2011. Compared to Norman’s proposal, which draws its inspiration from solid literature, the index proposed in Landi et al. (2018), called the Genoa Deprivation Index (GDI), is an innovative approach from a methodological point of view. The GDI is versatile and can also be replicated in other contexts. Furthermore, three different versions of the index have been developed by varying the aggregation technique, in order to test how the choice of methodology affects the final results and the ranking of scores. The techniques used were the additive aggregation method, MPI (Mazziotta & Pareto, 2012) and DP2 (Peña, 1977).
Bossert & D’Ambrosio (2019) are among the authors who have abandoned the concept of small area to develop a temporal deprivation index for the European Union, drawing on the extensive literature related to index proposals for the temporal analysis of relative poverty (Chakravarty et al., 1998; Diez et al., 2008; OECD, 2008; Alkire & Foster, 2011; Bossert et al., 2013). In a review of past experiences (e.g., Foster, 2009; Bossert et al., 2012; Dutta et al., 2013), Bossert & D’Ambrosio (2019) have selected 12 indicators from the Eurostat’s EU-SILC dataset, which can be classified into three different categories: financial difficulties, housing conditions and durable goods. Among the choices made for the construction of the index is the attribution of a weight, linked to the persistence of the deprivation status with respect to the length of the period for which the phenomenon occurs (Bossert et al., 2012), and the inclusion of the mitigating effect of possible periods of well-being (Dutta et al., 2013).
The analysis was conducted on 27 European Union Member States (EU27). Compared to the original dataset, Croatia was excluded, due to incomplete data in the period 2005-2009.
In order to select the most suitable indicators to represent the phenomenon to be analysed, the approach of choice is made to coincide with that adopted by EU-SILC. Regulation n°177/2003 of the European Parliament following the requests made by the European Councils of Lisbon, Nice, Stockholm and Laeken in the first years of the new millennium. The EU-SILC system collects subjective data. The items making up the EU-SILC database have been chosen on the basis of the social consensus criteria that guide EU development policies in the social field. At the same time, they have shared preconditions for pursuing the universal minimum level of living conditions (Mack & Lansley, 1985; Pantazis, 2006).
The information contained in the database is collected annually by the individual Member States, in close collaboration with the statistical office Eurostat, through specific research that allows to obtain both transversal and longitudinal micro-data at family and individual level. The data provided by EU-SILC allow comparisons on the basis of historical series.
The analysis is developed starting from indicators (table 1) that can be traced back to two distinct dimensions of analysis, that of “enforced lack” and that of “economic stress”. By ‘enforced lack of durable goods’ we mean the inability of an individual to have access to a certain good, even though this is strongly desirable by the deprived person. The expression ‘economic stress’ refers to the situation of disadvantage that would determine the social exclusion of an individual with respect to the context in which he or she is placed. For the statistical description of the data, see Table 4 in Appendix.
Table 1. Description of the indicators.
|
Indicator |
Indicator description |
|
|
Inability to afford a telephone |
Ilc_mddu01 |
“Does your household have a telephone (landline or mobile)? In case of a negative answer: (a) You would like to own it but cannot afford it; (b) You do not own it for other reasons”. In this case, the possession of the phone must coincide with its ownership: if it is rented or leased, the answer to the question will be “No”. If you consider the mobile phone, it is sufficient that even one member of the household owns it. |
|
Inability to own a colour TV |
Ilc_mddu02 |
“Does your household own a colour TV? In case of a negative answer: (a) You would like to own it but cannot afford it; (b) You do not own it for other reason”. If the TV is shared between several households, the answer to the question is “Yes” if access to it is easy and adequate (possibility to use it freely). In this case it is sufficient that even one of the family members is the owner of a colour TV. |
|
Inability to afford a washing machine |
Ilc_mddu04 |
“Does your household own a washing machine (automatic, washer-dryer or non-automatic “twin-tube”)? In case of a negative answer: (a) You would like to own it but cannot afford it; (b) You do not own it for other reason”. If the washing machine is shared between several households, the answer to the question is “Yes” if access to it is easy and adequate (possibility to use it freely). In this case it is sufficient that even one of the family members is the owner of a washing machine. |
|
Inability to afford one’s own car |
Ilc_mddu05 |
“Does your family have a car/van for private use? If you do not have a car/van: (a) You would like to have one but cannot afford it or (b) you do not have one for other reasons”. It should be noted that in this case possession does not determine the ownership of the good. Also excluded are company cars or the means necessary for the performance of one’s work and motorbikes. |
|
Inability to heat adequately one’s own home |
Ilc_mdes01 |
“Can your family afford to keep their home adequately heated?” The question refers to the economic capacity of the household to ensure adequate heating of its home, regardless of weather conditions or the actual need to keep it adequately warm. |
|
Inability to take one week’s holiday a year |
Ilc_mdes02 |
“Can your whole family afford to go on holiday one week a year, away from home, including stays in a second home or with friends/relatives? The question refers to the ability of the whole family to support this expense. If even one member of the household claims that they are unable to afford a week’s holiday, the answer of the entire household would be “No”. The presence of elderly or disabled people is an exception, only if the causes that make them unable are not attributable to the financial means of the household. |
|
Inability to afford a protein meal, or vegetarian alternative, every two days |
Ilc_mdes03 |
“Can your whole family afford a meal with meat, chicken, fish (or vegetarian alternative) every other day?” The indicator refers to the family’s ability to afford a protein meal, regardless of their willingness to eat it. |
|
Inability to cope with unforeseen expenses |
Ilc_mdes04 |
“Is your whole family able to cope with an unforeseen expense (amount to be paid) and to pay using their own resources?” The indicator refers to the household’s ability to incur unplanned expenses. “Own resources” refers to those that do not relate to loans or financial assistance and does not include payments by instalments, for expenses previously incurred with cash payments. |
|
Inability to meet overdue payments |
Ilc_mdes05 |
Investigates the possibility that the family has not been able to meet overdue payments (mortgage, rent, bills or rental purchases) in the last 12 months. |
|
Inability to make ends meet |
Ilc_mdes09 |
“A household may have several sources of income and each member may contribute to it. Thinking about the total income of your household, can your household make ends meet to support the common expenses? Given the impossibility of correctly translating the concept of “making ends meet” into all the languages of the EU countries, by convention we tend to refer to the capacity of a family unit to meet the common costs of its own housing. |
Source: Eurostat 2020.
This work is based on a formative approach, i.e., the indicators used, which cannot be substituted for one another, represent the cause of the phenomenon to be analysed (and not its effect) (May, 2017 a, b). In the literature, two main approaches can be identified that allow comparative analyses to be carried out from a hierarchical point of view: on the one hand, aggregative methods (Ciacci & Tagliafico, 2020; Ivaldi et al., 2020 a), and on the other, non-aggregative methods (Alaimo et al., 2020 b; Ivaldi et al., 2020 c). Among the former, the Adjusted Mazziotta and Pareto Index and the “stacking deprivation” method make it possible to perform time analyses (Norman, 2010; Mazziotta & Pareto, 2016, 2017, 2020). Among the non-aggregative methods, Posets allow the analysis of historical series (Alaimo et al., 2020 a). However, many contributions have been developed on an aggregative analytical system, well established in the literature (Ciacci et al., 2021; Ivaldi et al., 2020 b; Penco et al., 2020). For this reason, we have decided to use the AMPI method. The AMPI method is an aggregative method of analysis, partially non-compensatory in nature, as it prevents – at least partially – the occurrence of compensation between indicators with very uneven values. The construction of the AMPI index is a step-by-step process. The first step consists in transforming the original data matrix X = {xijt} into a normalised one R = {rijt}, according to the following formula:

where: rijt is the normalized value, xijt is the value of the indicator jth for the unit ith at the time tth, while Minxj and Maxxj indicate the ‘goalposts’ for the indicator j.
The second step is to fix the ‘goalposts’:
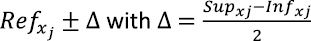
where: Refxj is the reference value, i.e. the value of the indicator jth in a specific unit ith at a specific time tth and Inf xj and Supxj are respectively the minimum and the maximum value of the indicator jth in all units and all time periods. In this application, goalposts have been calculated by assuming 2005 (first year of data collection) as a value time reference. In this way, each indicator assumes the value 100 for the reference unit considered in the time occasion considered in all basic indicators; all the other values of each unit for all the time occasions will be expressed about this value, allowing a comparison in time and space. Using this normalization, the range of the normalized values is (70, 130).
The third step consists in the aggregation and construction of the synthetic index, according to the following formula:
Where:
 are respectively the mean, the standard deviation and the coefficient of variation of the unit i and
the sign ± depends on the kind of phenomenon measured. In our case, all the composite indices are negative, i.e., increasing values of each index correspond to negative variations of the phenomenon so we need a positive penalty to correct
the average of standardised indicators by “pushing” it up (Mazziotta & Pareto, 2017).
are respectively the mean, the standard deviation and the coefficient of variation of the unit i and
the sign ± depends on the kind of phenomenon measured. In our case, all the composite indices are negative, i.e., increasing values of each index correspond to negative variations of the phenomenon so we need a positive penalty to correct
the average of standardised indicators by “pushing” it up (Mazziotta & Pareto, 2017).
The paper uses cluster analysis, also called “aggregation analysis”. This method represents one of the most common techniques of multivariate descriptive analysis with which to obtain a series of groupings of statistical units into classes, based on specific similarity criteria. In this study, the Ward Method, a clustering technique based on an aggregative algorithm, was adopted in order to achieve a grouping into classes for the 2019 year, then applied to the others (Ward, 1963). The peculiarity of this technique lies in the approach with which the groupings between classes are conducted, based on the statistical concept of the deconstruction of deviance into deviance between groups and deviance within groups. Among its main advantages, there is in fact the possibility of building a series of clusters with a low internal variance and a high external variance. In this way a greater homogeneity of the elements within the individual hierarchical partitions is guaranteed (Murtagh, 2014).
In order to assess the effectiveness of the methodological choices adopted, we evaluated the robustness of the index. Validating an index on the basis of its robustness allows us to analyse the sensitivity of the results and rankings obtained to possible variations in its structure. In this regard, among the best-known methods we identify Sensitivity Analysis (SA) and Uncertainty Analysis (UA).
One variant is represented by the Influence Analysis, which is a process of reconstructing the composite index in several variants by excluding a component each time. Through this approach it is possible to evaluate the importance of the single indicators with respect to the output, measuring the absolute average deviation of the ranks in the new rankings with respect to the one initially obtained (Mazziotta & Pareto, 2017):

The analysis of the results is organised as follows:
Table 2 shows the results listed as coefficients and ranks for each country analysed in the years 2005, 2010 and 2019. From table 2, Bulgaria remains consistently in first place for levels of deprivation over the three periods considered, although the level of deprivation in Bulgaria tends to decrease over the decade. Latvia, the second deprived country in 2005, fell by 4 positions during the period, becoming the sixth most deprived country in 2019. On the other hand, Romania sees its levels of deprivation oscillate between second position in 2010 and third one in 2019. Poland shows one of the most effective results in terms of the fight against material deprivation: the measures to combat the high levels of deprivation in 2005 (114.5) bear fruit and lead to a drop in the ranking of 8 positions (compared to 2019) and 10 positions as the best result during the period (compared to 2013-2015 period). Lithuania also succeeded in combating material deprivation over the years, albeit more modestly than Poland, going from rank 5th in 2005 to rank 7th in 2010, after which obtaining rank 4th in 2019 even if, compared to 2005 (112,8), it shows a decrease of AMPI score at the end of the period (96,8).
Table 2. Comparison of AMPI scores and rankings for the years 2005, 2010,2019.
|
Member State |
2005 |
2010 |
2019 |
|||
|
AMPI |
RANK |
AMPI |
RANK |
AMPI |
RANK |
|
|
Austria |
89,7 |
25 |
90,1 |
23 |
86,8 |
25 |
|
Belgium |
91,6 |
20 |
91,5 |
20 |
89,2 |
20 |
|
Bulgaria |
144,0 |
1 |
124,2 |
1 |
107,5 |
1 |
|
Cyprus |
102,4 |
10 |
104,6 |
5 |
96,2 |
5 |
|
Denmark |
90,9 |
22 |
89,5 |
25 |
89,4 |
18 |
|
Estonia |
101,0 |
11 |
95,9 |
14 |
90,4 |
14 |
|
Finland |
90,7 |
23 |
90,8 |
21 |
89,3 |
19 |
|
France |
90,6 |
24 |
89,8 |
24 |
89,9 |
16 |
|
Germany |
91,3 |
21 |
90,3 |
22 |
87,6 |
22 |
|
Greece |
98,8 |
13 |
101,9 |
10 |
105,0 |
2 |
|
Ireland |
93,5 |
18 |
95,9 |
15 |
91,6 |
11 |
|
Italy |
99,1 |
12 |
102,4 |
9 |
91,8 |
10 |
|
Latvia |
120,8 |
2 |
112,5 |
3 |
95,7 |
6 |
|
Lithuania |
112,8 |
5 |
103,7 |
7 |
96,8 |
4 |
|
Luxembourg |
92,5 |
19 |
93,6 |
17 |
85,3 |
27 |
|
Malta |
102,8 |
9 |
103,8 |
6 |
89,0 |
21 |
|
the Netherlands |
87,7 |
26 |
87,8 |
26 |
87,2 |
24 |
|
Poland |
114,5 |
4 |
100,2 |
12 |
90,7 |
12 |
|
Portugal |
103,7 |
8 |
103,4 |
8 |
92,3 |
9 |
|
United Kingdom |
94,2 |
16 |
93,1 |
19 |
89,9 |
15 |
|
the Czech Republic |
96,9 |
14 |
93,4 |
18 |
87,2 |
23 |
|
Romania |
120,7 |
3 |
120,4 |
2 |
102,4 |
3 |
|
Slovakia |
109,3 |
6 |
100,4 |
11 |
93,2 |
8 |
|
Slovenia |
93,7 |
17 |
93,7 |
16 |
89,8 |
17 |
|
Spain |
94,7 |
15 |
96,5 |
13 |
90,5 |
13 |
|
Sweden |
87,3 |
27 |
87,5 |
27 |
85,9 |
26 |
|
Hungary |
106,5 |
7 |
110,9 |
4 |
94,6 |
7 |
Source: Own elaboration.
From 2005 to 2010 Hungary shows a growth in deprivation which puts it in fourth place, only to decrease slightly years later until getting an AMPI+ coefficient equal to 94.6 (-11.9 compared to 2005). Cyprus is one of the countries that have shown the greatest suffering in the short term. Internal events and external shocks between 2005 and 2010 led to a general increase in deprivation levels. Cyprus moved from rank 10 to rank 5 in 2010 and settled in that position in 2019. A similar trend to that of Cyprus shows for Greece, although in this case the effects in terms of increased deprivation were even more pronounced in 2019, and therefore over a longer period of time. By 2019, Greece is the second European country by deprivation level (105) and the only country of EU27 that has ended with and higher AMPI+ coefficient than the initial one (+6.2).
Ireland and Italy are two of the cases of increased suffering because of the crisis. Both countries rose three places in the ranking from 2005 to 2010; between 2010 and 2019, Ireland climbed four more places, finally placing itself as the eleventh most deprived country, while Italy, in the same period, went from ninth to ten positions.
Moving the focus to the countries that have shown the lowest levels of deprivation over the years, we identify Sweden with the lowest level of deprivation for the majority of the period considered. The Netherlands is in 26 th place in 2005 and 2010, with minimal changes in the coefficient that led the country to the end of the period to be in rank 24th. Austria in 25 th position in 2005, up two positions in 2010 and then return to the initial rank in 2019. France shows an almost constant value of the coefficient, on moderate levels of deprivation. France settled at rank 24 th in both 2005 and 2010 and then moved up to rank 16th in 2019, which highlights a worsening of France performance compared to the other EU countries. Finland shows a constant trend over time of its coefficient, which varies from a maximum of 90.8 in 2010 to a minimum of 89.3 in 2019. Denmark, another Scandinavian country, has limited fluctuations in the value of the deprivation index than the other EU27 States, reason why it moves from rank 22nd in 2005 to 18th in 2019. Germany shows the solidity of its social fabric at the time of the crisis, strengthening its position in the ranking through continuous decreases in the AMPI+ coefficient (-1 from 2005 to 2010; -2.7 from 2010 and 2019.
Belgium, the United Kingdom, Slovenia, and Spain are examples of countries that have achieved a similar AMPI+ reduction at the end of the fourteen years and, except for the UK, they have shown a decrease in material deprivation even during the most critical years after the economic crisis. Spain for example has experienced the negative effects of the crisis since 2008 and, despite a positive brief period during 2011, has resumed the worsening of social exclusion in the following two years. After fourteen years, thanks to an inflection of the curve in 2014, the AMPI coefficient end its decrease at -4.2 points in 2019. The United Kingdom shows slight fluctuations over the decade and compared to 2005 end this period by moving just a position, from rank 16th to 15th. The UK improves its position by 2010 (from rank 16 th to 19th), although there is an increase of four positions from 2010 to 2019 (from rank 19 th to 15 th).
Estonia, Malta, Portugal, the Czech Republic, and Slovakia, on the other side, improved their social inclusion in 2019. From a comparison between 2005 and 2019, the most significant improvement is shown by Malta with the transition from position 9 to 21 in the EU27 ranking, although considering the coefficient AMPI+, Slovakia has one of the greatest achievements in the fight against social exclusion with a final decrease of 16.6 points. The Czech Republic, Estonia, and Portugal although less pronounced in numbers, until 2010. After that, both the Czech Republic and Slovakia show an improvement between 2010 and 2019, with the two countries rising by 3 and 1 positions respectively in the deprivation ranking.
Luxembourg, despite seeing the social effects of the crisis in 2010 (+1.1 of AMPI+), with an increase in deprivation, recovers in the next rank, up to a decrease of 8.3 AMPI + points in 2019.
Figure 1 provides a more accurate picture of the evolution of the phenomenon in the most deprived countries (see figure 4 in Appendix for the representation of the entire time series). In detail, figure 1 illustrates how the trend of the deprivation curves resulting from the index has evolved over all the years between 2005 and 2019, and how they have moved compared to the European average. The five Member States with the highest scores in 2005 are: Bulgaria, Lithuania, Romania, Poland, Latvia. This confirms the sensitivity of Eastern European countries – New member States (EU10) – to socio-economic problems underling by many authors (Matković et al. 2007, Fura et al. 2017).
Despite failing to improve its ranking, confirming its position as the most deprived country for the whole decade, Bulgaria shows a strong decrease in score compared to 2005. Except for the slight increase between 2010 and 2011, the value attributed by the index never exceeds 127, far from both the starting score of 144 and the final European average (=92). In comparison with the other country, Bulgaria has also the best performance at the end of the period with a decrease of 35.6 AMPI + points regarding the initial one.
The case of Latvia is different. From the point of view of the 2019, Latvia obtains a good result by losing 4 positions and dropping to the 6th rank. As shown in figure 1, the improvement cannot be attributed to a linear trend of deprivation over time. In fact, over the years, the score curve for Latvia alternates periods of decrease with increases in its value, especially during the period of the economic crisis. Despite the strong increase that finds its highest point in 2011, with an index value of 117.5 (3rd rank), in 2013 a new phase of degrowth begins that leads Latvia to obtain an AMPI + value equal to 95.7 in 2019.

Figure 1. Historical series 2005-2019 for the 5 most deprived countries. Source: Own elaboration.
The case of Poland is also extremely interesting: over the ten years it has achieved greater social inclusiveness for its population, falling in the ranking of EU27 countries from 4th to 12th place. Compared to the European average, the AMPI+ values that define the Poland curve show a continuous decrease in deprivation over time, interspersed with a slight increase in 2011 that temporarily interrupts the decrease. However, the index score has been steadily decreasing again since 2012, the year in which it is almost aligned with the European average. Then, in 2013, it can obtain a strongly positive result, bringing material deprivation in Poland below the average for the first time. The great result obtained by Poland and other easter European states over the fourteen years, creates a rift between EU10 countries. Poland and the Czech Republic have been able to improve their social fabric with a rise in social inclusion, however Bulgaria, Romania, Latvia, and Lithuania still show difficulty in aligning with the result of the majority of EU27 countries as confirmed by Fura et al. (2017).
Figure 2 shows the results obtained by the countries at the bottom of the list in 2005, thus showing a lower level of social exclusion compared to the European picture. These are Sweden, the Netherlands, Austria, France, and Finland. On the whole, there is no great variation between 2005 and 2019, if not a general worsening trend in the years of the economic crisis, common to all EU27 countries. Although there were some fluctuations in the various curves, the five countries ended the decade with a score which, although positive, was little different from that obtained in 2005.
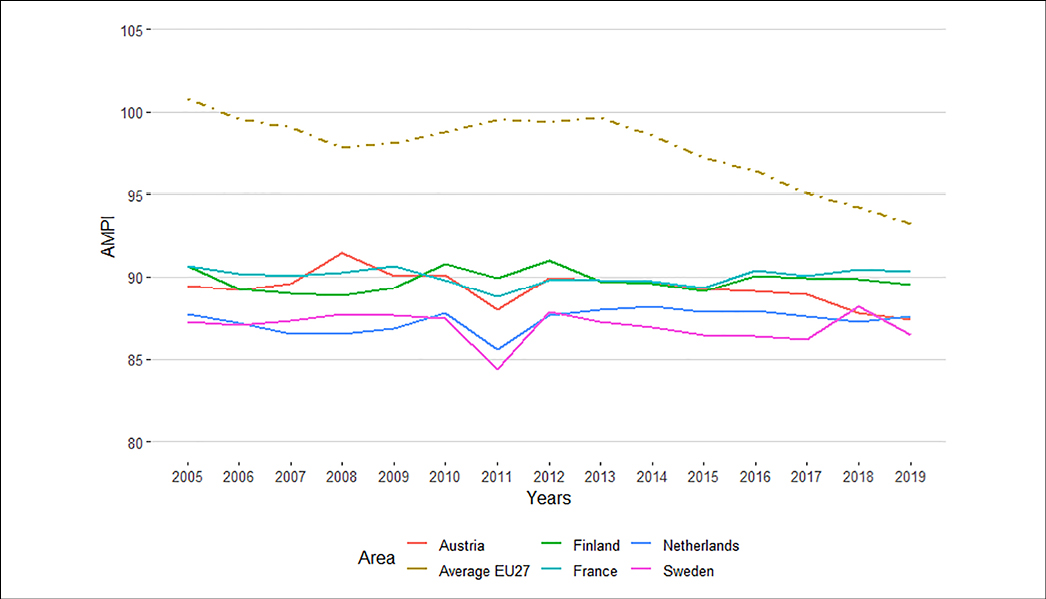
Figure 2. Historical series 2005-2019 for the 5 least deprived countries. Source: Own elaboration.
Figure 3 represents the cartogram with the distribution of deprivation levels in the various European countries in 2019. Looking at the figure 3, lower classes correspond to higher levels of deprivation. Therefore, the countries belonging to the class 5 show the lowest deprivation level of the distribution. The cut-off useful to determine the different levels of deprivation was obtained by applying the cluster analysis method to the 2019 scores (figure 5 in Appendix).

Figure 3. Distribution of material deprivation in EU27 countries in 2019. Source: Own elaboration.
Comparing figure 3 to the preview analysis of the evolution of material deprivation, the composition of the classes respects the values assigned by the deprivation index at the end of the period. What emerges defines two main trends for 2019. On a one hand, a positive scenario for the North-Western European countries shows a greater capacity to respond to the crisis, except for Ireland.
On the other hand, the real problems are found mainly among the former socialist countries of Eastern Europe and the Mediterranean countries that are in the last three classes, with regard to the countries of the Balkan peninsula – Greece, Romania, and Bulgaria – that make up the class that expresses maximum social exclusion. The countries of Eastern Europe therefore confirm their increased exposure to social exclusion, such as material deprivation, except for Poland and Estonia, which end the period in the fifth class of deprivation.
As seen before however, after the introduction of Europe2020 strategy even if with some trouble most of the countries have undertaken an improving process of the living conditions of the population, as confirmed by the AMPI scores analysis. Thanks to the joint intervention of European governments and institutions, the problems produced by the crisis have been contained within State boundaries and the scenario in 2019 highlights a widespread betterment in social living conditions although, in a benchmark perspective, disparities between member States are still present.
In order to test the robustness of the index, we report the results of the influence analysis in table 3. The Influence Analysis shows that the average deviation is extremely small (0.55). From this, it is possible to state that the index elaborated during the study is very robust from the point of view of its composition.
Table 3. Influence analysis.
|
Indicators |
Rank shift |
|
Inadequate heating in the home |
0.59 |
|
Inability to take one vacation a year |
0.74 |
|
Inability to afford a protein meal |
0.37 |
|
Unsustainability of unforeseen expenses |
1.63 |
|
Unsustainability of overdue expenses |
0.52 |
|
Lack of car ownership |
0.44 |
|
Lack of telephone (landline or mobile) |
0.22 |
|
Lack of washing machine |
0.15 |
|
Inability to make ends meet |
0.52 |
|
Lack of a TV |
0.30 |
|
Average |
0.55 |
|
St. Dev. |
0.42 |
Source: Own elaboration.
The Europe 2020 strategy is a policy document that also includes the definition of goals regarding the fight against deprivation and poverty. Its target is to reduce the number of European citizens living in poverty or social exclusion by 20 million (European Commission, 2010). European action comes at a time of crucial importance for recovery from a major economic and financial crisis.
Understanding a posteriori the evolution of deprivation in the years following the crisis means identifying the countries that have adopted the most effective countermeasures. The sharing of effective lines of action and the identification of benchmarks, therefore, depends on valid monitoring.
In this work we propose an analysis based on the construction of a time index (AMPI+) of material deprivation applicable to the countries of the European Union (Bossert & D’Ambrosio, 2019). This paper is aligned with the recent tradition of temporal analysis of relative poverty (see OECD, 2008; Alkire & Foster, 2011; Bossert et al., 2013; Landi et al., 2018). Our objective is to define the deprivation trend, based on the data collected by EU-SILC, over the period 2005-2019. Subjective EU-SILC data allows us to determine the preconditions for pursuing the universal minimum level of living conditions (Mack & Lansley, 1985; Pantazis, 2006).
Compared to some previous experiences that used complex index construction techniques (Norman, 2010; Bossert & D’Ambrosio, 2019; Bruzzi et al., 2020), the AMPI method has been versatile and functional for the construction of a time index in the absolute sense, as well as being able to enjoy a greater ease of calculation that makes our study easily replicable (Mazziotta & Pareto, 2016, 2017, 2020). We have also tried to identify which countries have maintained constant levels of deprivation, which have shown a worsening since the beginning of the crisis, and which have managed to contain the negative effects of the economic-financial shock.
At a global level, it is possible to identify a worsening of domestic conditions in most EU27 countries, coinciding with the years of economic crisis. In addition, the study of the variations in the distribution of the phenomenon on EU territory has made it possible to identify a greater worsening of the living conditions of the population in Eastern Europe and the Mediterranean area, with the first class of deprivation occupied by Bulgaria, Romania, and Greece in 2019 as opposed to the North-Western countries which shows a higher level of social inclusion. In this regard, we recall the contributions of Matković et al. (2007) and Fura et al. (2017), where authors reveal the condition of higher deprivation characterizing the eastern (ex-socialist) countries. Since their entry into the European Union and the combined transition toward a capitalist and free market-based system, it emerges eastern countries are continuously searching for a stabilisation. In a situation of high instability such as financial crisis of 2008, the process of adaption has been suddenly interrupted. In the absence of a cemented welfare system, the crisis has led to a return to higher levels of deprivation. Further developments in the analysis of the phenomena may concern the methodological and dynamic aspects of the indicators to turn them into usable tools, both politically and technically.
This study is not free from limitations, providing opportunities for further research. From a methodological viewpoint, it would be important to evaluate how the choice of determining material deprivation variables with a subjective approach, commonly used in individual well-being or economic disadvantage measurements (Chaaban et al., 2016; Alaimo & Maggino, 2020; Bianchi & Biffignandi, 2020) but not completely free from criticalities (Maggino, 2017 a, b), and the transition from the classic concept of “small area” (Jarman, 1983; Townsend, 1987; Bartley & Blane, 1994; Carr Hill et al., 2002) to national borders can impact the final interpretation of the results.
On the other hand, studies have shown that area-level deprivation not only serves as an individual-level proxy when data are unavailable, but it also has its own impact (Schuurman et al., 2007).
However, as confirmed by recent literature, the use of subjective indicators selected by the EU-SILC module and the extension of the scope of the indices to the national level is extremely widespread (Matković et al., 2007; Guio, 2009; Whelan & Maître, 2013, Bossert & D’Ambrosio, 2019). By combining these methodological choices, it is possible to limit the risks linked to the “small area”, e.g., ecological fallacy (Lancaster & Green 2002; Lokar et al., 2019) and unite modifiable problem (Openshaw & Taylor, 1981; Norman et al., 2008; Norman, 2010), ensuring greater representativeness of the characteristics of the population studied, and the comparability of information between the Member States due to the transversal and longitudinal nature of the data collection.
Even though this study has limitations, it has potential implications for the definition of public policies that contrast inequalities and unbalanced resource allocation in the different countries.
In this work, the research question to which we want to answer is the following: what are the European countries that more have suffered from deprivation due to the 2008 economic crisis? Trying to respond to this question, we have searched for a general path, if any. To do this we have employed a quantitative aggregative method, that is, AMPI.
Our results reveal that the most suffering countries are the Eastern, after the 2008 crisis. The existing deprivation gap between Western countries, from a side, and Eastern and Mediterranean countries, from the other side, widened in the years up to 2015. Considering the most deprived countries at the end of the period analysed, we refer to Poland, Lithuania, and Latvia, while the less deprived countries are Sweden, Austria, and the Netherlands.
To the best of our knowledge, there is not work analysing the deprivation evolution during the decade of the crisis by applying a quantitative aggregative method such as AMPI. This method allows us to develop a longitudinal analysis over the entire crisis period. We believe that this approach can have a double advantage: first, by applying AMPI is possible to identify the main paths characterizing a phenomenon with a certain precision; second, the AMPI method of aggregation is easy to replicate, readable and then, transparent. In summary, AMPI is purposive for our scopes since it is both effective and suitable. Therefore, the originality of our contribution lies in the fact that we measure the evolutionary deprivation trend by applying a robust and well-established quantitative method of analysis.
This paper represents an example of the functionality of the AMPI method to measure complex phenomena evolving during the time. Furthermore, we suggest AMPI approach as a valid tool to promote measurements having both a theoretical and practical purpose.
All authors undertake to disclose any existing or potential conflict of interest in relation to the publication of their article. Likewise, for articles with more than one author, the tasks carried out by each of them will be indicated.
Alaimo, L. S. & Maggino, F. (2020). Sustainable Development Goals indicators at territorial level: Conceptual and methodological issues. The Italian perspective. Social Indicators Research. https://doi.org/10.1007/s11205-019-02162-4
Alaimo, L.S., Arcagni, A., Fattore, M. & Maggino, F. (2020 a). Synthesis of Multi-indicator System Over Time: A Poset-based Approach. Social Indicators Research. https://doi.org/10.1007/s11205-020-02398-5
Alaimo, L. S., Ciacci, A. & Ivaldi, E. (2020 b). Measuring sustainable development by non-aggregative approach. Social Indicators Research. https://doi.org/10.1007/s11205-020-02357-0
Alkire S, & Foster J. (2011). Counting and multidimensional poverty measurement. Journal Public Economics, 95, 476–487. https://doi.org/10.1016/j.jpubeco.2010.11.006
Atkinson A.B. (1970). On the measurement of inequality. Journal of Economic Theory, 2(3), 244–263. https://doi.org/10.1016/0022-0531(70)90039-6
Bartley M. & Blane D. (1994). Commentary: Appropriateness of deprivation indices must be ensured. British Medical Journal, 309(6967), 1479. https://doi.org/10.1136/bmj.309.6967.1479
Bianchi, A. & Biffignandi, S. (2020). Workplace Social Environment Indicator: A Comparative Analysis of European Regions. Social Indicators Research. https://doi.org/10.1007/s11205-020-02344-5
Bossert W., Chakravarty S.R. & D’Ambrosio C. (2012). Poverty and time. The Journal of Economic Inequality, 10, 145–162. https://doi.org/10.1007/s10888-011-9175-2
Bossert W, Chakravarty S.R. & D’Ambrosio C. (2013). Multidimensional poverty and material deprivation with discrete data. Review of Income and Wealth, 10, 29–43. https://doi.org/10.1111/j.1475-4991.2012.00519.x
Bossert, W. & D’Ambrosio, C. (2019). Intertemporal Material Deprivation: A Proposal and an Application to EU Countries. In I. Dasgupta & M. Mitra (eds.) Deprivation, Inequality and Polarization. Economic Studies in Inequality, Social Exclusion and Well-Being. Springer. https://doi.org/10.1007/978-981-13-7944-4_2
Brulé, G. & Maggino, F. (2017). Towards more complexity in subjective well-being studies. In G. Brulé & F. Maggino (eds.) Metrics of subjective well-being: Limits and improvements (pp. 1–17). Springer. https://doi.org/10.1007/978-3-319-61810-4_1
Bruzzi, C., Ivaldi, E. & Landi, S. (2020). Non-compensatory aggregation method to measure social and material deprivation in an urban area: relationship with premature mortality. European Journal of Health and Economics, 21(3), 381-396. https://doi.org/10.1007/s10198-019-01139-x
Calandrino, M. (2003). Low-income and Deprivation in British Families: An Exploratory Analysis of the ‘consistent Poverty’ Approach to Poverty Measurement Using Data for Great Britain Drawn from the Families and Children Study: a Study Carried Out on Behalf of the Department for Work and Pensions. Department for Work and Pensions.
Carr Hill, R., Jamison, J., O’reilly, D., Stevenson, M. & Reid, J. (2002). Risk adjustment for hospital use using social security data: cross sectional small area analysis. British Medical Journal, 324-390. https://doi.org /10.1136/bmj.324.7334.390
Castairs, V. & Morris., R. (1991). Deprivation and Health in Scotland. Aberdeen University Press.
Chaaban, J., Irani, A. & Khoury, A. (2016). The Composite Global Well-Being Index (CGWBI): A new multi-dimensional measure of human development. Social Indicators Research. https://doi.org/10.1007/s11205-015-1112-5
Chakravarty, S.R., Mukherjee, D. & Ranade, R. (1998). On the family of subgroup and factor decomposable measures of multidimensional poverty. Research on economic inequality: a research annual, 8, 175–194.
Ciacci, A., Ivaldi, E. & Soliani, R. (2021). A potential business environment of a smart cities: a subjective approach. Strategic Outlook. In H. Dinçer & S. Yüksel (eds.) Business and Finance Innovation: Multidimensional Policies for Emerging Economies (pp. 11-23). Emerald Publishing Limited. https://doi.org/10.1108/978-1-80043-444-820211002
Ciacci, A. & Tagliafico, G. (2020). Measuring the Existence of a Link between Crime and Social Deprivation within a Metropolitan Area. Revista de Estudios Andaluces, 40, 58-77. https://dx.doi.org/10.12795/rea.2020.i40.04
Cuadrado-Roura, J.R., Martin, R. & Rodríguez-Pose, A. (2016). The economic crisis in Europe: urban and regional consequences, Cambridge Journal of Regions, Economy and Society, 9(1), 3–11, https://doi.org/10.1093/cjres/rsv036
Diener, E. & Biswas-Diener, R. (2002). Will money increase subjective well-being? Social Indicators Research, 57, 119–169. https://doi.org/10.1023/A:1014411319119
Diez, H, Lasso de la Vega, C. & Urrutia, A. (2008). Multidimensional unit- and subgroup consistent inequality and poverty measures: some characterization results. Research on Economic Inequality: a Research Annual, 16, 189–211. https://doi.org/10.1016/S1049-2585(08)16009-4
Dutta, I., Roope, L., & Zank, H. (2013). On intertemporal poverty measures: the role of affluence and want. Social Choice and Welfare, 41, 741–762. https://doi.org/10.1007/s00355-012-0709-8
European Commission (2010). Europe 2020: A European Strategy for smart, sustainable and inclusive growth. Communication No. COM (2010) 2020, European Commission. https://ec.europa.eu/eu2020/pdf/COMPLET%20EN%20BARROSO%20%20%20007%20-%20Europe%202020%20-%20EN%20version.pdf
Foster, J. (2009). A class of chronic poverty measures. In T. Addison, D. Hulme & R. Kanbur (eds.) Poverty dynamics: interdisciplinary perspectives (pp. 59-76). Oxford University Press. https://doi.org/10.1093/acprof:oso/9780199557547.003.0003
Fura, B., Wojnar, J. & Kasprzik, B. (2017). Ranking and classification of EU countries regarding their levels of implementation of the Europe 2020 strategy. Journal of Cleaner Production, 165, 968-979. https://doi.org/10.1016/j.jclepro.2017.07.088
Fusco, A., Guio, A. & Marlier, E. (2013). Building a Material deprivation index in a multinational context: lessons from the EU experience. In V. Bérenger & F. Bresson (eds) Poverty and Social Exclusion around the Mediterranean Sea (.), Chapter 2. https://doi.org/10.1007/978-1-4614-5263-8_2
Gini, C. (1912). Variabilità e Mutuabilità. Contributo allo Studio delle Distribuzioni e delle Relazioni Statistiche. C. Cuppini.
Guio, A.C. (2009). What can be learned from deprivation indicators in Europe? Eurostat methodologies and working paper. Eurostat, Luxembourg. https://ec.europa.eu/eurostat/documents/3888793/5845041/KS-RA-09-007-EN.PDF.pdf/6d80bc28-534a-4fae-9783-9983e05ca20a?t=1414779512000. Accessed on June 12, 2021.
Israel, S., & Spannagel, D. (2019). Material deprivation in the EU: a multy-level analysis on the influence of decommodification and defamilisation policies. Acta Sociologica, 62(2), 152-173. https://doi.org/10.1177/0001699318778735
Ivaldi, E. & Testi, A. (2011). Genoa index of deprivation (GDI): An index of material deprivation for geographical areas. In C. M. Baird (ed.), Social indicators: Statistics, trends and policy development. Nova Science Publishers.
Ivaldi, E. & Ciacci, A. (2020). Measuring level of technological infrastructure in smart cities a non-compensatory approach. In H. Dinçer and S. Yüksel (eds.), Strategic Priorities in Competitive Environments. Multidimensional Approaches for Business Success. Springer. https://doi.org/10.1007/978-3-030-50131-0_5
Ivaldi, E., Parra Saiani, P., Primosich, J.J. & Bruzzi, C. (2020 a). Health and Deprivation: A New Approach Applied to 32 Argentinian Urban Areas. Social Indicators Research. https://doi.org/10.1007/s11205-020-02369-w
Ivaldi, E., Penco, L., Isola, G. & Musso, E. (2020 b). Smart Sustainable Cities and the Urban Knowledge-Based Economy: A NUTS3 Level Analysis. Social Indicators Research 150, 45–72. https://doi.org/10.1007/s11205-020-02292-0
Ivaldi, E., Ciacci, A. & Soliani, R. (2020 c). Urban deprivation in Argentina: a POSET analysis. Papers in Regional Science, 99(6), 1723-1747. https://doi.org/10.1111/pirs.12555
Jarman, B. (1983). Identification of underprivileged areas. British Medical Journal, 286, 1705-1709. https://doi.org/10.1136/bmj.286.6379.1705
Lancaster, G. & Green, M. (2002). Deprivation, ill-health and the ecological fallacy, Journal Royal Statistic Society A, 165(2), 263-278. https://doi.org/10.1111/1467-985X.00586
Landi, S., Ivaldi, E. & Testi, A. (2018). Measuring Change Over Time in Socio-economic Deprivation and Health in an Urban Context: The Case Study of Genoa. Social Indicators Research, 139, 745–785. https://doi.org/10.1007/s11205-017-1720-3
Lokar, K., Zagar, T. & Zadnik, V. (2019). Estimation of the Ecological Fallacy in the Geographical Analysis of the Association of Socio-Economic Deprivation and Cancer Incidence. International Journal of Environmental Research and Public Health, 16, 296. https://doi.org/10.3390/ijerph16030296
Macintyre, S., Ellaway, A. & Cummins, S. (2002). Place effects on health: how we can conceptualise, operationalise and measure them? Social Science and Medicine, 55, 125-139. https://doi.org/10.1016/s0277-9536(01)00214-3
Mack, J. & Lansley, S. (1985). Poor Britain. Allen and Unwin.
Maggino, F. (2017 a). Developing indicators and managing the complexity. In F. Maggino (ed.), Complexity in Society: From Indicators Construction to their Synthesis, Social Indicators Research Series 70. https://doi.org/10.1007/978-3-319-60595-1_5
Maggino, F. (2017 b). Dealing with Syntheses in a System of Indicators. In F. Maggino (ed.), Complexity in Society: From Indicators Construction to their Synthesis, Social Indicators Research Series 70. https://doi.org/10.1007/978-3-319-60595-1_5
Matković, T., Šućur, Z. & Zrinščak, S. (2007). Inequality, poverty, and material deprivation in new and old members of the European Union. Croatian Medical Journal, 48(5), 636-52.
Mazziotta, M. & Pareto, A. (2012). A non-compensatory approach for the measurement of the quality of life. In F. Maggino and G. Nuvolati (Eds.), Quality of life in Italy: Research and reflections, 27–40. Springer. https://doi.org/10.1007/978-94-007-3898-0_3
Mazziotta, M. & Pareto, A. (2016). On a generalized non-compensatory composite index for measuring socio-economic phenomena. Social Indicators Research, 127, 983–1003. https://doi.org/10.1007/s11205-015-0998-2
Mazziotta, M. & Pareto, A. (2018). Measuring Well-Being Over Time: The Adjusted Mazziotta–Pareto Index Versus Other Non-compensatory Indices. Social Indicators Research, 136(3), 967–976. https://doi.org/10.1007/s11205-017-1577-5
Mazziotta, M. & Pareto, A. (2020). Composite Indices Construction: The Performance Interval Approach. Social Indicators Research. https://doi.org/10.1007/s11205-020-02336-5
Murtagh, F. & Legendre, P. (2014). Ward’s Hierarchical Agglomerative Clustering Method: Which Algorithms Implement Ward’s Criterion? Journal of Classification 31, 274–295. https://doi.org/10.1007/s00357-014-9161-z
Norman, P., Gregory, I., Dorling, D. & Baker, A. (2008). Geographical trends in infant mortality: England and Wales, 1970–2006. Health Statistics Quarterly, 40, 18–29.
Norman, P. (2010). Identifying change over time in small area socio-economic deprivation. Applied Spatial Analysis and Policy, 3(2-3), 107-138. https://doi.org/10.1007/s12061-009-9036-6
OECD (2008). Handbook on constructing composite indicators. Methodology and user guide. OECD Publications. https://www.oecd.org/sdd/42495745.pdf. Accessed on June 12, 2021.
Openshaw, S. & Taylor, P.J. (1981). The modifiable areal unit problem. In N. Wrigley & R.J. Bennett (eds.) Quantitative Geography: a British View (pp. 335-350). Routledge and Kegan Paul.
Pantazis, C., Townsend, P. & Gordon, D. (2006). The necessities of life. In C. Pantazis, D. Gordon D. & R. Levitas, Poverty and social exclusion in Britain. The millennium survey, Chapter 4 (pp. 89–122).
Peña, J.B. (1977). Problemas de la medicio´n del bienestar y conceptos afines (Una aplicacio´n al caso espanol). Instituto Nacional de Estadística (INE).
Penco, L., Ivaldi, E., Bruzzi, C. & Musso, E. (2020). Knowledge-based urban environments and entrepreneurship: Inside EU cities. Cities, 96. https://doi.org/10.1016/j.cities.2019.102443
Schuurman, N., Bell, N., Dunn, J.R. & Oliver, L. (2007). Deprivation indices, population health and geography: an evaluation of the spatial effectiveness of indices at multiple scales. Journal of Urban Health, 84(4), 591–603. https://doi.org/10.1007/s11524-007-9193-3
Sen, A. (1999). Development as freedom. Oxford University Press.
Stiglitz, J., Sen, A. & Fitoussi, J.-P. (2009). Report by the Commission on the Measurement of Economic Performance and Social Progress. https://ec.europa.eu/eurostat/documents/8131721/8131772/Stiglitz-Sen-Fitoussi-Commission-report.pdf. Accessed on March 22, 2020.
Townsend, P. (1979). Poverty in the United Kingdom. Allen Lane and Penguin Books. https://doi.org/10.1525/9780520325760
Townsend, P. (1987). Deprivation. Journal of Social Policy, 16(2), 125–146. https://doi.org/10.1017/S0047279400020341
Townsend, P., Phillimore, P. & Beattie, A. (1988). Health and deprivation: Inequality and the North. Croom Helm.
Ward, J.H. (1963). Hierarchical Grouping to Optimize an Objective Function, Journal of the American Statistical Association, 58, 236–244. https://doi.org/10.1080/01621459.1963.10500845
Whelan, C.T. & Maître, B. (2013). Material Deprivation, Economic Stress and Reference Groups in Europe: An Analysis of EU-SILC 2009. European Sociological Review, 29(6), 1162–1174. https://doi.org/10.1093/esr/jct006
Table 4. Data statistical description for 2005, 2012 and 2019 years.
|
Variable |
Minimum |
1st quartile |
Median |
Mean |
3rd |
Maximum |
Skewness |
Kurtosis |
|
2005 |
||||||||
|
Ilc_mddu01 |
0.90 |
3.60 |
9.40 |
15.14 |
18.36 |
69.50 |
1.75 |
6.09 |
|
Ilc_mddu02 |
10.20 |
24.10 |
40.60 |
43.63 |
66.05 |
77.50 |
0.10 |
1.54 |
|
Ilc_mddu04 |
1.90 |
3.50 |
6.60 |
14.06 |
20.27 |
58.50 |
1.45 |
4.20 |
|
Ilc_mddu05 |
14.10 |
25.15 |
34.70 |
39.18 |
51.75 |
76.80 |
0.66 |
2.26 |
|
Ilc_mdes01 |
1.00 |
3.45 |
9.90 |
10.85 |
14.80 |
35.70 |
1.09 |
3.88 |
|
Ilc_mdes02 |
1.00 |
3.45 |
9.90 |
10.85 |
14.80 |
35.70 |
1.09 |
3.88 |
|
Ilc_mdes03 |
1.80 |
4.50 |
9.10 |
13.93 |
23.50 |
42.96 |
1.05 |
2.79 |
|
Ilc_mdes04 |
0.00 |
0.30 |
0.80 |
2.21 |
3.20 |
12.50 |
1.92 |
6.23 |
|
Ilc_mdes05 |
0.10 |
0.60 |
1.00 |
3.44 |
2.10 |
25.30 |
2.48 |
8.57 |
|
Ilc_mdes09 |
0.10 |
0.30 |
0.50 |
0.96 |
0.95 |
5.80 |
2.64 |
10.20 |
|
2012 |
||||||||
|
Ilc_mddu01 |
0.60 |
4.45 |
8.10 |
12.89 |
20.60 |
46.50 |
1.16 |
3.63 |
|
Ilc_mddu02 |
11.90 |
24.60 |
48.40 |
41.83 |
53.25 |
75.40 |
-0.07 |
1.83 |
|
Ilc_mddu04 |
1.40 |
3.60 |
8.90 |
12.42 |
16.15 |
51.90 |
1.67 |
5.98 |
|
Ilc_mddu05 |
20.70 |
27.60 |
42.10 |
42.34 |
54.00 |
75.00 |
0.53 |
2.22 |
|
Ilc_mdes01 |
2.30 |
5.20 |
11.60 |
13.37 |
19.60 |
35.00 |
0.72 |
2.62 |
|
Ilc_mdes02 |
2.30 |
5.20 |
11.60 |
13.37 |
19.60 |
35.00 |
0.72 |
2.62 |
|
Ilc_mdes03 |
1.60 |
5.05 |
7.90 |
10.47 |
12.40 |
40.50 |
1.76 |
6.03 |
|
Ilc_mdes04 |
0.00 |
0.10 |
0.40 |
0.79 |
0.70 |
6.00 |
2.80 |
10.35 |
|
Ilc_mdes05 |
0.10 |
0.35 |
0.60 |
1.63 |
1.30 |
13.10 |
2.98 |
11.08 |
|
Ilc_mdes09 |
0.00 |
0.25 |
0.40 |
0.50 |
0.60 |
1.50 |
1.14 |
3.60 |
|
2019 |
||||||||
|
Ilc_mddu01 |
1.80 |
2.65 |
5.40 |
8.14 |
8.65 |
30.10 |
1.54 |
4.30 |
|
Ilc_mddu02 |
10.10 |
17.00 |
27.70 |
27.94 |
38.10 |
54.10 |
0.20 |
1.97 |
|
Ilc_mddu04 |
0.80 |
2.45 |
4.80 |
6.64 |
9.85 |
27.60 |
1.94 |
7.41 |
|
Ilc_mddu05 |
15.10 |
24.10 |
31.40 |
31.42 |
35.55 |
49.80 |
0.30 |
2.28 |
|
Ilc_mdes01 |
2.80 |
5.65 |
8.20 |
10.14 |
10.85 |
41.40 |
2.51 |
9.44 |
|
Ilc_mdes02 |
0.00 |
0.25 |
0.40 |
1.01 |
0.95 |
7.40 |
2.85 |
10.15 |
|
Ilc_mdes03 |
1.60 |
4.25 |
5.50 |
7.00 |
8.20 |
23.40 |
1.68 |
5.93 |
|
Ilc_mdes04 |
0.00 |
0.00 |
0.10 |
0.27 |
0.30 |
2.50 |
3.51 |
15.96 |
|
Ilc_mdes05 |
0.00 |
0.25 |
0.40 |
1.02 |
0.95 |
7.40 |
2.85 |
10.15 |
|
Ilc_mdes09 |
0.00 |
0.20 |
0.30 |
0.39 |
0.45 |
1.50 |
1.86 |
7.27 |

Figure 4. AMPI scores evolving in the time.
