Natural Disasters and Mortality: A Probabilistic Analysis
for Argentina (1970-2015)
Fernando Antonio Ignacio González
faigonzalez@iiess-conicet.gob.ar  https://orcid.org/0000-0002-8347-9808
Instituto de Investigaciones Económicas y Sociales del Sur,
Universidad Nacional del Sur (UNS)-Consejo Nacional de Investigaciones Científicas y Técnicas (CONICET).
San Andrés 800, Bahía Blanca-Argentina.
KEYWORDS
Natural disasters
Floods
Mortality risk
Information diffusion method
Probabilistic analysis
Argentina
1. INTRODUCTION
A disaster is a serious disruption of the functioning of a community or society involving widespread human, material, economic or environmental losses and impacts, which exceeds the ability of the affected community or society to cope with using its own resources (United Nations International Strategy for Disaster Reduction [UNISDR], 2009). If the primary cause of the disaster is nature, it is called a natural disaster, while if it is directly generated by human behaviour it is called an anthropogenic or technological disaster. This work examines natural disasters and this includes geophysical, hydrological, meteorological and climatological disasters (Centre for Research on the Epidemiology of Disasters [CRED], 2009).
Globally, a growing consensus has developed around the idea of joint consideration of the multiple types of natural disasters that occur in a country or region to enable a comprehensive analysis of the risk profile (Kousky, 2012; Liu, Siu & Mitchell, 2016). Frequently, the risk analysis associated with multiple natural disasters is conceived in a relative way: based on the construction of indexes -which consider elements of hazard, exposure and vulnerability- qualitatives or semi-quantitatives, comparisons are made between countries or regions to detect those zones which present a greater risk of disaster (Xu, Zhuo, Zheng, Gu & Tian, 2016). The foregoing, however, does not allow to quantify joint probabilities of occurrence of disasters or losses exceedance probabilities.
The estimation of probabilistic models applied to the analysis of natural disasters has many precedents (Grunthal et al., 2006; Askan & Yucemen, 2010; Winter, Schneeberger, Huttenlau & Stotter, 2017, Stephenson, Hunter, Youngman & Cook, 2018). Frequently, probabilistic models assume a certain distribution for natural disaster losses (parametric estimation) and use historical disaster data to estimate distribution parameters (Grunthal et al., 2006; Winter et al., 2017). Given the limited availability of historical disaster data -that is, small samples- nonparametric estimation methods are used (Xu et al., 2016). This includes estimates of kernel density, histogram density and information diffusion.
On the other hand, Huang (1997) proposed the use of the information diffusion method to overcome the limitations of non-parametric methods in contexts where historical data on disasters are limited (Liu, Siu, Mitchell & Xu, 2013; Xu et al., 2016).
In this context, the present work tries to contribute to the estimation of exceedance probabilities of losses of human lives (mortality) associated with multiple natural disasters in Argentina -that is, an absolute risk measure- between 1970-2015. In turn, given the existence of deep regional disparities in Argentina, in terms of income, poverty, life expectancy, education, prices -among others- (Longhi & Osatinsky, 2017; González, 2020) the estimates are conducted by region, making it possible to compare them.
2. CONCEPTUAL FRAMEWORK
The potential damage resulting from a disaster does not depend solely on the underlying natural hazard (geophysical, meteorological, hydrological or climatic event) but also on the exposure to this hazard (location in affected areas) and on vulnerability arising from the existence of basic material deprivations. In other words, the so-called natural disaster is a complex interrelation between the natural and socio-economic dimension (Barrenechea, Gentile, González & Natenzon, 2000; Natenzon, 2016) and the disaster risk arises from the combination of these 3 elements (hazard, exposure and vulnerability).
Liu et al. (2013) develop a multi-hazard risk assessment method based on information diffusion theory to overcome the lack of historical and spatial data on natural disasters. They provide estimates for the China’s Yangtze River Delta region and find that Hangzhou and Ningbo cities are those of highest risk (measure by exceedance probabilities) while Shanghai presents the lowest risk. The estimated exceedance probabilities of one death are 0.99 and 0.20, respectively. The estimates are normalized considering population. These authors remark that the exceedance probability is the inverse of the return period, this is, the risk associated to a 0.05 (5%) exceedance probability is the same as a 20-years return period.
Also for the Chinese case, Xu et al. (2016) provides estimates of exceedance probabilities for meteorological disasters. They find that southeastern provinces present a higher risk of multiple meteorological hazards as a result of their geographical location and topography.
Liu, Siu & Mitchell (2017) consider multiple natural disasters and their potential interactions in the case of the northeast region of Zhejiang (China). They show that a short period of time between natural disasters (two successive hurricanes for example) significantly increases the expected losses in the affected region. This takes place because people are particularly vulnerable after the first disaster and do not reach a full rebuild before the second event takes place.
3. METHODS
Methodology
The procedure for the calculation of exceedance probabilities based on the information diffusion method is detailed below, following Liu et al. (2013) and Xu et al. (2016). Equations (1) to (9) must be estimated for each of the r regions and, in turn, equations (1) to (6) for each of the d types of natural disasters considered. Equations (7) to (9) proceed with the aggregation of natural disasters by region.
Let mt be the deaths toll caused -in a certain region and by type of natural disaster- in year t and be Ud he fuzzy set of the number of deaths -for the entire analysed period-, which is determined from the historical disasters data and is in the interval [0-r] -being r a positive integer-. So:

The mortality data of each year can be diffused to the discrete domain of discourse from the following equation:
where h is the diffusion coefficient established from the minimum and maximum mortality values -mmin and mmax, respectively- and the sample size n -defined by the number of years in the sample-:

Huang (1997) details h values for different sample sizes. The information distribution -ut(uj)-, is obtained from the normalization of ft (uj ) and the result can be expressed as a continuous probability density function:

Then, the probability distribution p(uj) in uj can be calculated from equations (5) and (6):
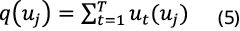

where is the probability distribution of 0-r deaths for a given type of natural disaster. On the other hand, assuming that the occurrence of each natural disaster considered is independent of the occurrence of other disasters, the deaths toll caused by multiple natural disasters () can be obtained as:

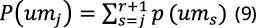
Therefore, the probability distribution of deaths caused by multiple natural disasters can be calculated as:

where is the number of deaths () caused by each type of natural disaster d. Finally, mortality exceedance probability due to multiple natural disasters,, is obtained as:
In summary, the computation of exceedance probabilities allows us to know which is the probability -in a given region- of experience annually, at least, a certain death number due to multiple natural disasters. In this way, the exceedance probability of 0 deaths will be equal to 1, while for arbitrarily high values the exceedance probability tends to 0.
Data source
In Argentina, the most complete historical record of natural disasters is the Disasters Inventory System (DesInventar in Spanish), developed by the Social Studies Network on Disaster Prevention in Latin America (LA RED in Spanish), in which are registered different types of natural and anthropic disasters occurred in Argentina, between 1970-2015, with a level of disaggregation up to the municipal level. For each registered event, information is provided on the number of people exposed, estimated economic losses, damages caused, duration and type of disaster. The database is constructed from reports of newspapers of national circulation.
4. RESULTS AND DISCUSSION
The loss curves by region are presented in Graph 1. It is observed that the Centro region is the one with the highest exceedance probabilities. This implies that the complementary cumulative distribution function of this region first order stochastically dominates the functions of the other regions. In turn, the NEA region is first order stochastically dominated by the other regions -in terms of their respective complementary cumulative distribution functions-.
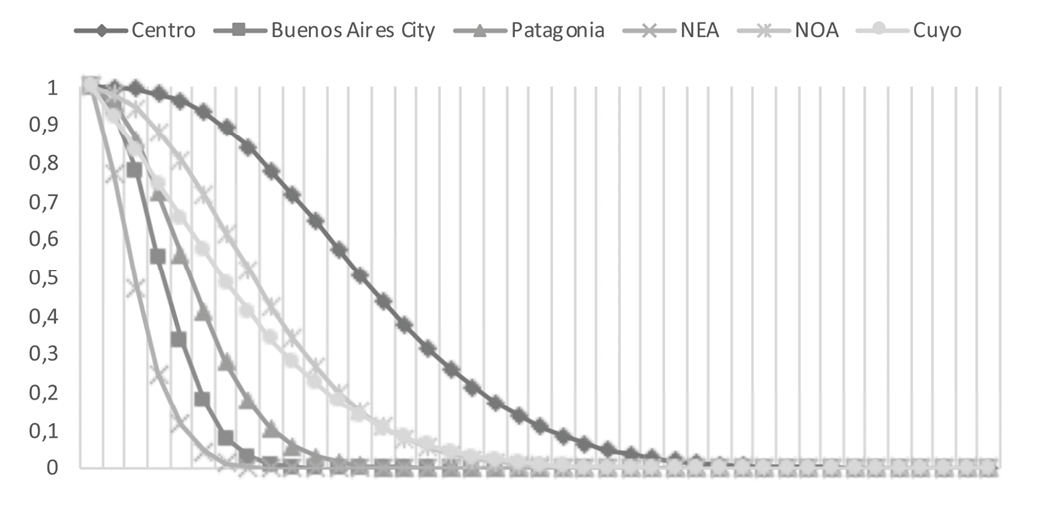
Graph 1. Loss curves (deaths) for regions in Argentina, 1970-2015. Source: Own elaboration based on DesInventar (2018).
5. CONCLUSIONS
This work provided novel estimates of mortality risk for the Argentine case. This was the main contribution in the analysis of natural disasters. However, further research is needed. In particular, the presence of geographical bias in DesInventar records must be examine. This is, given that the records in this database are built from what is reported by the main newspapers in the country, it is reasonable to think that the disasters that take place in the Centro region will be better recorded than those that take place in peripheral regions.