Natural Disasters and Mortality: A Probabilistic Analysis
for Argentina (1970-2015)
Desastres Naturales y Mortalidad: Análisis Probabilístico
de Argentina (1970-2015)
Fernando Antonio Ignacio González
faigonzalez@iiess-conicet.gob.ar  https://orcid.org/0000-0002-8347-9808
Instituto de Investigaciones Económicas y Sociales del Sur,
Universidad Nacional del Sur (UNS)-Consejo Nacional de Investigaciones Científicas y Técnicas (CONICET).
San Andrés 800, Bahía Blanca-Argentina.
INFO ARTÍCULO
Recibido: 10-04-2020
Revisado: 01-06-2020
Aceptado: 04-06-2020
KEYWORDS
Natural disasters
Floods
Mortality risk
Information diffusion method
Probabilistic analysis
Argentina
ABSTRACT
The frequency and intensity of natural disasters are expected to increase due to climate change. In this context, this work advances in the estimation of an absolute measure of mortality risk generated by natural disasters, in regions of Argentina. In particular, exceedance probabilities of mortality are estimated using the information diffusion method.
The historical data of natural disasters provided by the records of DesInventar are used. These records cover the 1970-2015 period and are published by the Social Studies Network in Disaster Prevention in Latin America (LA RED).
The results suggest that the Centro region is the one with the highest risk of absolute mortality, while the Noreste region has the lowest risk levels. In a given year there is a 0.93 probability that, at least, one death will occur due to natural disasters in the Centro region. In the Noreste region, this probability is 0.77. The results are robust and significant.
PALABRAS CLAVE
Desastres naturales
Inundaciones
Riesgo de mortalidad
Método de difusión de la información
Análisis probabilístico
Argentina
RESUMEN
Se espera que la frecuencia e intensidad de los desastres naturales aumenten, a futuro, debido al cambio climático. En este contexto, este trabajo avanza en la estimación de una medida absoluta del riesgo de mortalidad generado por desastres naturales, en regiones de Argentina. En particular, se estiman probabilidades de excedencia de mortalidad utilizando el método de difusión de información.
Se utilizan los datos históricos de desastres naturales proporcionados por los registros de DesInventar. Estos registros cubren el período 1970-2015 y son publicados por la Red de Estudios Sociales en Prevención de Desastres en América Latina (LA RED).
Los resultados sugieren que la región Centro es la que tiene el mayor riesgo de mortalidad absoluta, mientras que la región Noreste tiene los niveles de riesgo más bajos. En un año dado hay una probabilidad de 0.93 de que, al menos, una muerte tenga lugar debido a desastres naturales en la región Centro. En la región de Noreste, esta probabilidad es 0.77. Los resultados son robustos y significativos.
1. INTRODUCTION
A disaster is a serious disruption of the functioning of a community or society involving widespread human, material, economic or environmental losses and impacts, which exceeds the ability of the affected community or society to cope with using its own resources (United Nations International Strategy for Disaster Reduction [UNISDR], 2009). If the primary cause of the disaster is nature, it is called a natural disaster, while if it is directly generated by human behaviour it is called an anthropogenic or technological disaster. This work examines natural disasters and this includes geophysical, hydrological, meteorological and climatological disasters (Centre for Research on the Epidemiology of Disasters [CRED], 2009).
Every year a large number of natural disasters of all kinds take place globally. During 2019 alone, natural disasters affected 95 million people worldwide -with an estimated mortality of more than 11,000 people- and generated losses of US$ 130 billion (CRED, 2020). In the future, an increase in the frequency and severity of natural disasters, associated with climate chaange, is expected (Banholzer, Kossin & Donner, 2014; Montroull, Saurral & Camilloni, 2018; IPCC, 2018).
In the case of Argentina, natural disasters that took place, between 1980-2018, implied a cost of U$S 24.000 million in economic losses and generated 1037 deaths directly (Munich Re, 2019) , being the most frequent disasters floods (32%), tempests (21%) and forest fires (8%) (DesInventar, 2018). In 2018, Argentina was among the ten most disaster-affected countries in the world (CRED, 2019). In turn, of all registered natural disasters in Argentina, between 1970-2015, 41% occurred in the last fifteen years (DesInventar, 2018). This seems to suggest a growing trend in the frequency of disasters. However, other factors may explain this: for example, the availability of better disaster records or a greater social interest in them.
Globally, a growing consensus has developed around the idea of joint consideration of the multiple types of natural disasters that occur in a country or region to enable a comprehensive analysis of the risk profile (Kousky, 2012; Liu, Siu & Mitchell, 2016). Frequently, the risk analysis associated with multiple natural disasters is conceived in a relative way: based on the construction of indexes -which consider elements of hazard, exposure and vulnerability- qualitatives or semi-quantitatives, comparisons are made between countries or regions to detect those zones which present a greater risk of disaster (Xu et al., 2016). The relative risk approach is adopted in numerous publications at regional and global level (UNDP, 2004; World Bank, 2005; Brecht, Deichmann & Gun Wang, 2013; German Watch, 2019). The foregoing, however, does not allow to quantify joint probabilities of occurrence of disasters or losses exceedance probabilities. In this regard, knowing -in probabilistic terms- the economic cost or human deaths associated with different natural disasters is relevant in the assessment and mitigation of risk.
The estimation of probabilistic models applied to the analysis of natural disasters has many precedents (Grunthal et. al, 2006; Askan & Yucemen, 2010; Winter, Schneeberger, Huttenlau & Stotter, 2017, Stephenson, Hunter, Youngman & Cook, 2018). Frequently, probabilistic models assume a certain distribution for natural disaster losses (parametric estimation) and use historical disaster data to estimate distribution parameters (Grunthal et al., 2006; Winter et al., 2017). Given the limited availability of historical disaster data -that is, small samples- nonparametric estimation methods are used (Xu et al., 2016). This includes estimates of kernel density, histogram density and information diffusion. The use of histograms presents the difficulty of choosing the intervals, while the estimation of kernel densities implies defining an adequate bandwidth (Liu, Siu, Mitchell & Xu, 2013).
On the other hand, Huang (1997) proposed the use of the information diffusion method to overcome the limitations of non-parametric methods in contexts where historical data on disasters are limited (Liu et al., 2013; Xu et al., 2016). In particular, this method adopts notions specific from the theory of fuzzy sets and where each observation can belong -with different probabilities- to multiple subsets of the domain of the data. This allows to improve the estimation of probabilities based on the expansion of observations.
In this context, the present work tries to contribute to the estimation of exceedance probabilities of losses of human lives (mortality) associated with multiple natural disasters in Argentina -that is, an absolute risk measure- between 1970-2015. In turn, given the existence of deep regional disparities in Argentina, in terms of income, poverty, life expectancy, education, prices -among others- (Longhi & Osatinsky, 2017; González, 2020) the estimates are conducted by region, making it possible to compare them.
From now on, section 2 presents the conceptual framework, section 3 describes the methodology, the source of information and the regionalization adopted for the Argentine case. Section 4 presents the results and finally, section 5 considered main conclusions.
2. CONCEPTUAL FRAMEWORK
The impact of natural disasters on mortality is a topic that has been widely studied. This work focuses on those deaths directly attributable to the disaster. However, the literature suggests that after the disaster, mortality may also increase due to diseases such as hepatitis E, gastrointestinal disease or leptospirosis in the case of floods (Alderman, Turner, &Tong, 2012), respiratory diseases after extreme temperatures (Gronlund, Sullivan, Kefelegn, Cameron & O´neill, 2018) or some kind of psychological distress after earthquakes (Matsubayashi, Sawada & Ueda, 2013; Fujiwara et al., 2017).
In aggregate terms, the literature has highlighted the relevance of two factors in explaining mortality from disasters. First, location at the time of the disaster determines the exposure, or not, to the disaster. Some countries are more prone to extreme events due to their location or climate. The literature has also advanced in the study of differences within the same city or region: often poor people are located in high risk areas (Hallegatte, Vogt-Schilb, Rozenberg, Bangalore & Beaudet, 2020). This means that a higher mortality from disasters is expected in developing countries and in the poorer regions within countries. The empirical evidence confirms this: despite the number of disasters is similar in developed and developing countries, most deaths occur among developing ones (Hu, Zhang, Shi, Chen & Fang, 2018; CRED, 2015). Of all the natural disasters that took place, in 2015, 44% occurred in low-income countries while 68% of all deaths from natural disasters occur in these countries. In other words, each disaster causes, on average, three times as many deaths in a low-income country than in a high-income country (CRED, 2015).
Second, household conditions are of great importance during a disaster (Frankenberg, Thomas, Samuel, Bondan & Duncan, 2011; Hallegatte, Vogt-Schilb, Rozenberg, Bangalore & Beaudet, 2020). A household with precarious materials (in the ceiling or walls) is undoubtedly more exposed to potential negative consequences in the event of an extreme disaster. This risk is transferred to its occupants. Also, increasing time indoors due to extreme outdoor conditions might have indirect adverse health consequences (Gronlund et al., 2018). Lack of access to basic services, such as drinkable water, electricity, or a sewer network, also increases the risk of mortality given the simultaneousness between infectious diseases and the disaster. These material deprivations (precarious housing and lack of access to basic services), in conjunction with other factors, determine the susceptibility or predisposition of a community or individual to suffer damage in the case a disaster occurs -i.e. vulnerability to disasters- (Inter-American Development Bank, 2003).
From the above, it appears that the potential damage resulting from a disaster does not depend solely on the underlying natural hazard (geophysical, meteorological, hydrological or climatic event) but also on the exposure to this hazard (location in affected areas) and on vulnerability arising from the existence of basic material deprivations. In other words, the so-called natural disaster is a complex interrelation between the natural and socio-economic dimension (Barrenechea, Gentile, González & Natenzon, 2000; Natenzon, 2016) and the disaster risk arises from the combination of these 3 elements (hazard, exposure and vulnerability).
The risk of disasters in Argentina has some relevant features. First, almost a third of the Argentine population is concentrated in the Gran Buenos Aires agglomerate. Its increasing population density and urbanization patterns make this agglomerate especially susceptible to the occurrence of disasters (Ríos, 2014). Wide disparities of disaster risk are observed within this agglomerate (Herrero, Natenzon & Miño, 2018). Floods are especially worrying in this case (Barros et al., 2006; Ríos & González, 2011) but also in other regions (Maldonado, Natenzon & Cóccaro, 2005; Casco, 2011). However, given the territorial breadth of Argentina, its regions present different profiles of disaster risk (Viand & Briones, 2015).
The Argentine case stands out for the existence of wide territorial disparities in vulnerability to disasters. The northern provinces of Argentina are those with the highest levels of incidence of poverty, infant mortality, malnutrition, among others (Longhi & Osatinsky, 2017). These provinces include the Noreste (NEA) and Noroeste (NOA) regions (see section 3 for a detailed explanation). Some of these regional disparities are analysed in Table 1 in which selected indicators are presented. It can be observed that the NEA, with 9% of the population, contributes with 3.7% of GDP, 1.7% of total exports, and only 4.4% of all registered jobs. NOA shares are somewhat better, but also disproportionate in relation to their population contribution. The NEA and NOA infant mortality rates are two to three points higher than in the other regions, and the percentage of the population with Unsatisfied Basic Needs is approximately double that in the rest of the regions. Child malnutrition also has worrying prevalences in northern Argentina (Bolzan et al., 2005).
Table 1. Selected indicators by region.
|
Region
|
Populationa
|
Share of population
|
Share of GDPb
|
Share of exportsc
|
Share of registered jobsd
|
|
NEA
|
3,679,609
|
9.17
|
3.75
|
1.7
|
4.42
|
|
NOA
|
4,911,412
|
12.24
|
6.46
|
7
|
7.44
|
|
Cuyo
|
2,852,294
|
7.11
|
6.41
|
5.7
|
6.07
|
|
Centro
|
26,573,593
|
66.24
|
75.07
|
73.4
|
75.57
|
|
Patagonia
|
2,100,188
|
5.24
|
8.31
|
8.4
|
6.50
|
|
Argentina
|
40,117,096
|
100
|
100
|
100
|
100
|
Source: Own elaboration based on data from Ministerio de Economía, Ministerio de Trabajo and the Censo Nacional de Población, Hogares y Vivienda (2010).
aOwn calculations based on the Censo Nacional de Población, Hogares y Vivienda (2010).
bOwn calculations based on INDEC (2004).
cInformation extracted from INDEC (2018). Exports of undetermined origin or those goods subject to a temporary admission regime are not included.
dOwn calculations for the IV Quarter of 2017 based on the Ministerio de Producción y Trabajo de la Nación (2018).
Such a disadvantageous position for the provinces of Northern Argentina is not recent (Cortés Conde, 1998; Díaz Orueta, González Villar, Lourés & Sintes, 2000; Gorenstein et al., 2012). It goes back to the origins of the formation of the national space (since the end of the 18th century), where the City of Buenos Aires and the Centro region tended to concentrate most of the productive structure. This was favoured by political decisions such as the closure of inland rivers to the navigation of overseas, the status of Buenos Aires as the only port, the monopoly of customs revenues, the concentration of rail lines around Buenos Aires and the free access of imported manufactures, with which the interior economies could not compete. Later stages tended to perpetuate existing disparities (González, 2019).
In a context of wide regional disparities, this work provides estimates of mortality risk from natural disasters in Argentina. However, a first limitation is the relative scarcity of mortality records. For Argentina, the only complete database is DesInventar and in most of its records there is no information on the number of deaths associated with each disaster. Given this scarcity of mortality records an information diffusion method is used -trying to overcome this lack of data- (Huang, 1997). This allows generating non-parametric and absolute estimates of mortality risk. Logically, this work builds on the theoretical and empirical contributions of previous works on this topic.
Liu et al. (2013) develop a multi-hazard risk assessment method based on information diffusion theory to overcome the lack of historical and spatial data on natural disasters. They provide estimates for the China’s Yangtze River Delta region and find that Hangzhou and Ningbo cities are those of highest risk (measure by exceedance probabilities) while Shanghai presents the lowest risk. The estimated exceedance probabilities of one death are 0.99 and 0.20, respectively. The estimates are normalized considering population. These authors remark that the exceedance probability is the inverse of the return period, this is, the risk associated to a 0.05 (5%) exceedance probability is the same as a 20-years return period.
Also for the Chinese case, Xu et al. (2016) provides estimates of exceedance probabilities for meteorological disasters. They find that southeastern provinces present a higher risk of multiple meteorological hazards as a result of their geographical location and topography.
Extending the analysis of disaster risk, Bai, Zhang, Hong, Qian & Wang (2014) propose an algorithm to assess the risk of earthquakes in the Chinese province of Yunnan. They compare this algorithm with other methods (neural networks and regression analysis) and find that their algorithm based on the method of information diffusion generates a better estimate of risk.
Yang, Hu & Jaeger (2016) focus on the analysis of hurricanes for the case of the Chinese province of Hainan. They explore the risk of loss in transportation network and find that the most important spatial characteristics includes location and that the high-way network of Hainan may suffer a 90% damage every 4.28 years (return period).
Liu, Siu & Mitchell (2017) consider multiple natural disasters and their potential interactions in the case of the northeast region of Zhejiang (China). They show that a short period of time between natural disasters (two successive hurricanes for example) significantly increases the expected losses in the affected region. This takes place because people are particularly vulnerable after the first disaster and do not reach a full rebuild before the second event takes place.
To the best of my knowledge, a few other studies exist and this includes the analysis of risk of crop loss (Balezentis, Streimikiene, Melnikiene & Yu, 2017; Xu et al., 2019) and precipitation risk (Olya & Alipour, 2015). In particular, Balezentis et al. (2017) propose a non-parametric measure of yield risk for Lithuanian crop farming and find that maize, buckwheat and winter rape presents the highest yield risk. Xu et al. (2019) focus on the Chinese case and study the crop loss risk due to heavy rain and strong wind in the Yangtze River Delta. They find that districts located in the southeast of the region are those that present a higher risk. In turn, the risk decreases, between districts, from south to north and from east to west. Finally, Olya & Alipour (2015) explore the relationship between precipitation risk and tourism for the case of North Cyprus. They find that the northern borders of the island are exposed to higher levels of precipitation, resulting in adverse effects on tourism.
It should be noted that the literature on this topic (non-parametric estimates using information diffusion method) is really scarce. All the antecedents I cite date from the last 5 years and most of them provide estimates for the case of China. This method allows obtaining robust probability estimates -when historical records are scarce- and normative decisions are not required as in other non-parametric methods.
3. METHODS
3.1 Methodology
The procedure for the calculation of exceedance probabilities based on the information diffusion method is detailed below, following Liu et al. (2013) and Xu et al. (2016). Equations (1) to (9) must be estimated for each of the r regions and, in turn, equations (1) to (6) for each of the d types of natural disasters considered. Equations (7) to (9) proceed with the aggregation of natural disasters by region.
Let mt be the deaths toll caused -in a certain region and by type of natural disaster- in year t and be Ud the fuzzy set of the number of deaths -for the entire analysed period-, which is determined from the historical disasters data and is in the interval [0-r] -being r a positive integer-. So:

The mortality data of each year can be diffused to the discrete domain of discourse from the following equation:
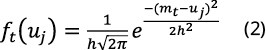
where h is the diffusion coefficient established from the minimum and maximum mortality values -mmin and mmax, respectively- and the sample size n -defined by the number of years in the sample-:

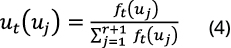
Huang (1997) details h values for different sample sizes. The information distribution -ut(uj)-, is obtained from the normalization of ft (uj ) and the result can be expressed as a continuous probability density function:
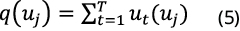
Then, the probability distribution p(uj) in uj can be calculated from equations (5) and (6):
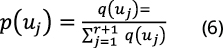
where p (uj) is the probability distribution of 0-r deaths for a given type of natural disaster. On the other hand, assuming that the occurrence of each natural disaster considered is independent of the occurrence of other disasters, the deaths toll caused by multiple natural disasters (umj) can be obtained as:
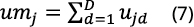
Therefore, the probability distribution of deaths caused by multiple natural disasters can be calculated as:

where ujd is the number of deaths (uj) caused by each type of natural disaster d. Finally, mortality exceedance probability due to multiple natural disasters, P (umj), is obtained as:
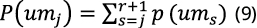
In summary, the computation of exceedance probabilities allows us to know which is the probability -in a given region- of experience annually, at least, a certain death number due to multiple natural disasters. In this way, the exceedance probability of 0 deaths will be equal to 1, while for arbitrarily high values the exceedance probability tends to 0.
3.2 Stochastic dominance and comparisons between regions
From the exceedance probabilities it is possible to construct loss curves relating number of deaths (X axis) with exceedance probabilities (Y axis) -by region-. The greater the slope of the curve, the higher the probability of occurrence of a given event -in this case, deaths from disasters- and the greater the area under the loss curve, the greater the uncertainty about the occurrence of a given event -that is, the probability distribution is wider-.
Advantageously, the loss curves allow comparison between regions based on the use of stochastic dominance techniques, that is, they allow concluding if a region is unambiguously more or less risky than another in terms of mortality from natural disasters. In particular, if an accumulated distribution function F(x) allows knowing the non-exceedance probability for a given value b of x -that is, the probability of obtaining a value less than or equal to b-, a loss curve can be understood as the complement of an accumulated distribution function [1-F(x)], that is, computes the exceedance probability for a given value of x. Complementary cumulative distribution functions are also called survival functions in other disciplines (Alkire et al., 2015).
In this way, let F1(x) be the function representing the loss curve of region 1, it is said that first order stochastically dominates F2(x) -the loss function of region 2- if F1(x) ≥ F2(x) for all x and F1(x) (x)>F2(x) for some x. This implies that, if F1(x) stochastically dominates F2(x), no matter how many deaths are chosen for comparison, the exceedance probability of region 1 will always be greater than or equal to the exceedance probability of region 2 and, therefore, it will be region 1 the one that presents -unambiguously- the highest absolute risk of mortality due to natural disasters.
The use of stochastic dominance techniques -when making comparisons between regions- gives the advantage that the conclusions obtained are robust, that is, valid for any chosen mortality value. However, in case the loss curves intersect -in at least one point- the criterion does not allow reaching a conclusion and, therefore, the ordering is incomplete. Trying to overcome the above, some applications have implemented restricted stochastic dominance techniques, that is, limited to a certain interval of the distribution function (Alkire & Santos, 2014).
It should be considered that, despite the possible existence of first order stochastic dominance between any pair of regions -comparing the exceedance probabilities for all mortality values- this does not imply that the differences are significant. In this regard, advancing the issue, Santos & Zaratiegui (2017) test the significance of the differences between two distributions using a Kolmogorov-Smirnov type test proposed by Barrett & Donald (2003). Considering two representative functions of the loss curves of regions 1 and 2 - F1(x) and F2(x), respectively-, the hypotheses to be considered are:
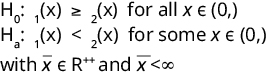
If H0 is not rejected, F1(x) first order stochastically dominates F2(x). The considered statistic is:
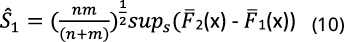
where sups it is the supremum of the difference between both empirical distributions and, n and m are the sample sizes for distributions 1 and 2, respectively. Then, the values obtained for the statistic Ŝ1 must be compared with the critical values suggested by Barret & Donald (2003) -1,073, 1,2239 and 1,5174 for significance levels of 10%, 5% and 1%, respectively - and the null hypothesis is rejected if Ŝ1 is greater than the critical reference value.
Successively, the test can be repeated for each pair of considered distributions, evaluating the significance of the differences. For each pair considered, it is possible to test whether F1(x) stochastically dominates F2(x) or, if on the contrary, F2(x) is the one that stochastically dominates.
3.3 Data source
In Argentina, the most complete historical record of natural disasters is the Disasters Inventory System (DesInventar in Spanish), developed by the Social Studies Network on Disaster Prevention in Latin America (LA RED in Spanish), in which are registered different types of natural and anthropic disasters occurred in Argentina, between 1970-2015, with a level of disaggregation up to the municipal level. For each registered event, information is provided on the number of people exposed, estimated economic losses, damages caused, duration and type of disaster. The database is constructed from reports of newspapers of national circulation.
In particular, for the 1970-2015 period, DesInventar presents -for each type of natural disaster considered in this work- the following mortality records:
Table 2. Deaths per type of natural disaster in Argentina 1970-2015.
|
Natural disaster
|
Number of deaths
|
%
|
|
Avalanche
|
44
|
1.57
|
|
Alluvium
|
208
|
7.43
|
|
Landslide
|
31
|
1.11
|
|
Hailstorm
|
9
|
0.32
|
|
Frost
|
317
|
11.33
|
|
Forestal fire
|
104
|
3.72
|
|
Flood
|
796
|
28.45
|
|
Rain
|
51
|
1.82
|
|
Fog
|
160
|
5.72
|
|
Snowstorm
|
118
|
4.22
|
|
Heat wave
|
14
|
0.50
|
|
Drought
|
13
|
0.46
|
|
Earthquake
|
100
|
3.57
|
|
Tempest
|
499
|
17.83
|
|
Electric storm
|
104
|
3.72
|
|
Twister
|
31
|
1.11
|
|
Gale
|
199
|
7.11
|
|
Total
|
2798
|
100
|
Source: Own elaboration based on DesInventar (2018).
In the examined period, 1970-2015, there were more than 2,600 deaths associated with the analyzed natural disasters according to the records of DesInventar. Floods and tempests explain almost 50% of deaths toll.
3.4. Regions in Argentina
The Argentine territory is divided into regions which include two or more provinces. The National Institute of Statistics and Censuses (INDEC in Spanish) -the official statistical agency of Argentina- considers the existence of six regions (INDEC, 2019):
‒Noreste (NEA): covers the provinces of Misiones, Corrientes, Chaco and Formosa.
‒Noroeste (NOA): includes the provinces of Salta, Jujuy, Tucumán, Santiago del Estero, Catamarca and La Rioja.
‒Cuyo: covers the provinces of Mendoza, San Juan and San Luis
‒Centro: includes Entre Ríos, Santa Fe, Córdoba and Buenos Aires
‒Patagonia: covers Rio Negro, Neuquén, Santa Cruz, Chubut, Tierra del Fuego and La Pampa.
‒Gran Buenos Aires (GBA): includes the City of Buenos Aires and its suburbs -districts from the Province of Buenos Aires- which constitute the Gran Buenos Aires agglomerate (INDEC, 2003).
Due to the limited geographical disaggregation in DesInventar’s disaster records, it is not possible to identify -in all cases- the city of disaster occurrence. For this reason, it is not possible -for the districts of the suburbs of the City of Buenos Aires- to determine if a disaster should be attributed to Gran Buenos Aires or to the Centro region. Consequently, from now on, it is decided to include the suburbs of the City of Buenos Aires within the Centro region. That is, all the districts of the Province of Buenos Aires are part of the Centro region.
Map 1 presents the location of the Argentine regions. In each case, the number of disasters occurred and their participation in the national total are indicated.
It should be noted that, in 1987, the provinces that constitute the NEA and NOA regions celebrated the Norte Grande Argentino Integration Treaty (NGA in Spanish), following criteria of geographical proximity and socio-economic similarities. In this way, a region encompassing the ten provinces of northern Argentina was created. For its part, the province of La Pampa, which is frequently included in the Centro region, celebrated the Patagonian Provinces Agreement in 1996 and, therefore, opts for its inclusion among the Patagonian provinces. Table 3 presents the distribution of population and area by region in Argentina:
Table 3. Area and population by region in Argentina, 2010.
|
Region
|
Population in %
|
Area in % (km2)
|
|
Buenos Aires City
|
7.20
|
0.007
|
|
Centro
|
58.25
|
24.62
|
|
Cuyo
|
7.11
|
11.34
|
|
NEA
|
9.17
|
10.42
|
|
NOA
|
12.24
|
20.14
|
|
Patagonia
|
6.03
|
33.47
|
|
Argentina
|
40117096
|
2780400
|
Source: Own elaboration based on National Population, Household and Housing Census 2010.
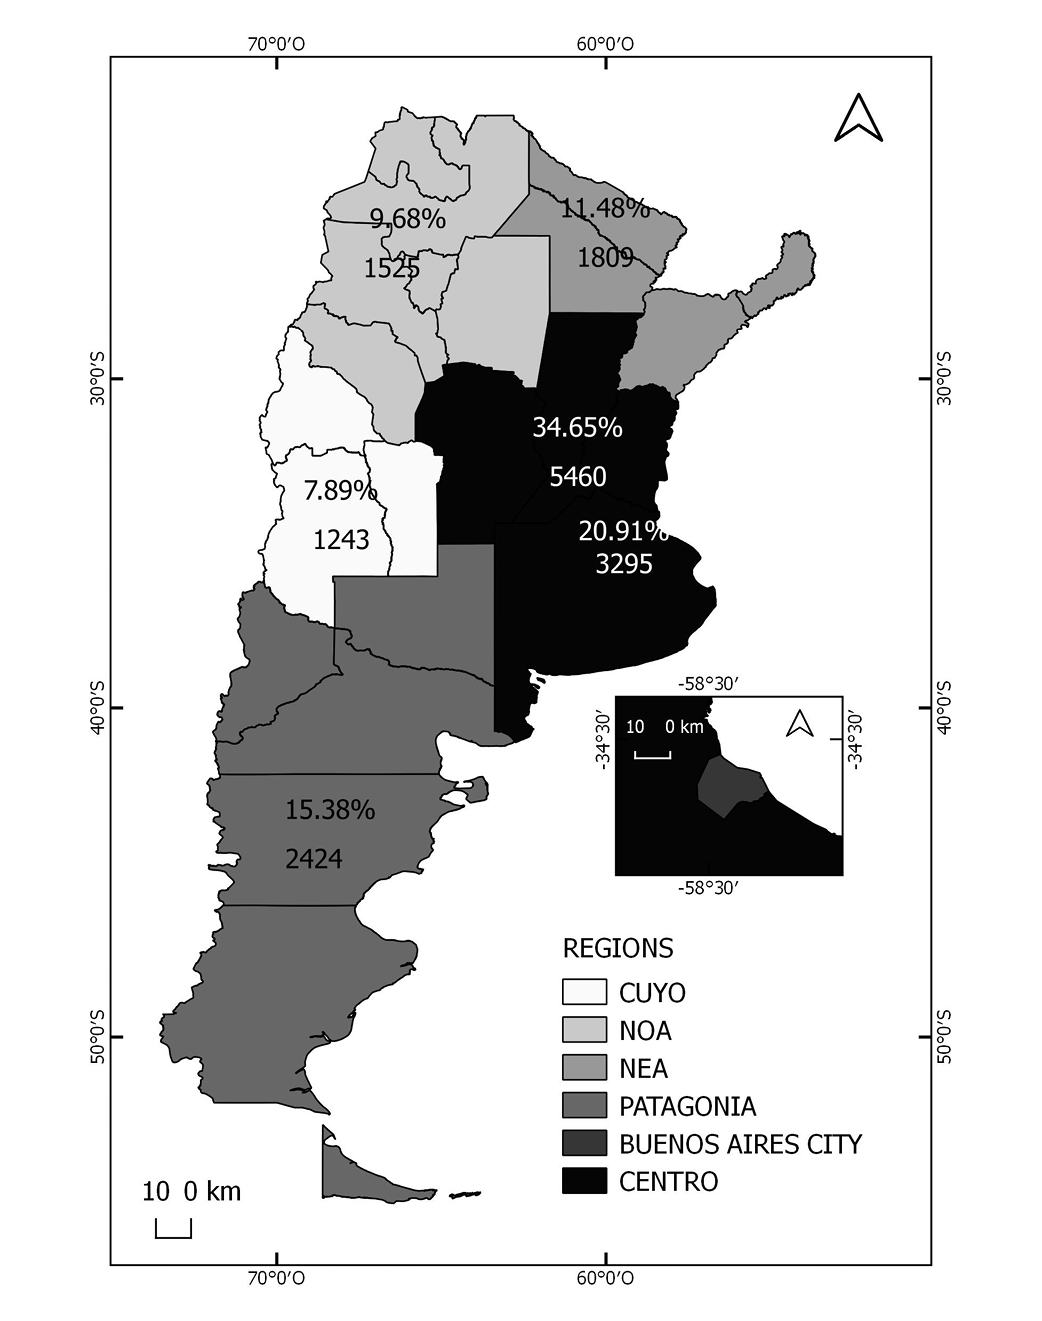
Map 1. Argentine regions and frequency of natural disasters. Source: Own elaboration based on DesInventar (2018). Note: regionalization corresponds to INDEC (2019). All the districts of the Province of Buenos Aires are included in the Centro region. % indicates the proportion of disasters that, of the Argentine total, occurred in each region.
It is observed that, Argentina is a country with wide regional imbalances: Buenos Aires City, with 0.007% of the surface of the country, concentrates about 7% of the total population. The Patagonia, in turn, with a large area concentrates a smaller population.
4. RESULTS AND DISCUSSION
Next, Table 4 presents the exceedance probabilities, by region, of mortality due to multiple natural disasters.
Table 4. Exceedance probabilities from natural disasters for a given number of deaths in regions of Argentina (1970-2015).
|
Region
|
1
|
2
|
3
|
5
|
10
|
20
|
30
|
Death tolla
|
|
Buenos Aires City
|
0.939
|
0.777
|
0.552
|
0.175
|
0.001
|
0.000
|
0.000
|
316
|
|
Centro
|
0.999
|
0.994
|
0.982
|
0.931
|
0.646
|
0.108
|
0.004
|
1163
|
|
Cuyo
|
0.919
|
0.833
|
0.745
|
0.570
|
0.224
|
0.010
|
0.000
|
272
|
|
NEA
|
0.772
|
0.473
|
0.248
|
0.044
|
0.000
|
0.000
|
0.000
|
219
|
|
NOA
|
0.982
|
0.943
|
0.883
|
0.715
|
0.265
|
0.006
|
0.000
|
446
|
|
Patagonia
|
0.957
|
0.860
|
0.720
|
0.409
|
0.031
|
0.000
|
0.000
|
382
|
Source: Own elaboration based on DesInventar (2018).
aNumber of deaths, per region, between 1970-2015.
The Centro region has the highest exceedance probabilities for any number of deaths chosen in the comparison. The NEA, on the other hand, has the lowest exceedance probabilities. It is striking that, even with similar populations, the exceedance probabilities in some regions are widely dissimilar. This is valid in the NOA and NEA comparison and to a lesser extent, Cuyo and Patagonia. In this way, the absolute number of deaths and population -by region- do not seem to follow a linear relationship.
These results are, partially, in line with previous evidence. In particular, Liu et al. (2013) report exceedance probabilities of one death of 0.8 or higher (except for Shanghai) and the same is true for Xu et al. (2016). However, the differences in probabilities across observational units are less pronounced in this work than in Liu et al. (2013). This is, the difference between the Centro and NEA regions for one death -for example- (0.99 and 0.77) is smaller than that between Hangzhou and Shanghai (0.99 and 0.20). This may be due to differences in the aggregation level of observational units. While Liu et al. (2013) consider cities of a region of China, this work employs regions (defined as a set of provinces). Xu et al. (2016) analyse Chinese provinces and report similar results to those of this work.
On the other hand, the loss curves by region are presented in Graph 1. Again, it is observed that the Centro region is the one with the highest exceedance probabilities. This implies that the complementary cumulative distribution function of this region first order stochastically dominates the functions of the other regions. In turn, the NEA region is first order stochastically dominated by the other regions -in terms of their respective complementary cumulative distribution functions-.
The Buenos Aires City, Patagonia, NOA and Cuyo regions have intersecting loss curves and, therefore, it is not possible to establish a complete ordering of regions. Table 5 describes the existence of relations of first order stochastic dominance between regions (table 5).

Graph 1. Loss curves (deaths) for regions in Argentina, 1970-2015. Source: Own elaboration based on DesInventar (2018).
Table 5. First order stochastic dominance in regions of Argentina (mortality).
|
|
Dominated
|
|
|
|
Centro
|
Cuyo
|
Buenos Aires City
|
NEA
|
NOA
|
Patagonia
|
|
Dominates
|
Centro
|
***
|
YES
|
YES
|
YES
|
YES
|
YES
|
|
Cuyo
|
NO
|
***
|
INC
|
YES
|
INC
|
INC
|
|
Buenos Aires City
|
NO
|
INC
|
***
|
YES
|
NO
|
NO
|
|
NEA
|
NO
|
NO
|
NO
|
***
|
NO
|
NO
|
|
NOA
|
NO
|
INC
|
YES
|
YES
|
***
|
YES
|
|
Patagonia
|
NO
|
INC
|
YES
|
YES
|
NO
|
***
|
Source: Own elaboration based on DesInventar (2018).
Note: INC is Inconclusive (there is no first order stochastic dominance).
It is observed that the Cuyo region is the one with the most cases where it is not possible to conclude unambiguously about the existence of first order stochastic dominance. For its part, the NOA dominates stochastically Patagonia and Buenos Aires City, while Patagonia dominates the Buenos Aires City.
It is also evaluated the significance of the differences for each pair of regions in which the existence of a relationship of stochastic dominance is observed (Table 6), using the test proposed by Barret & Donald (2003). The statistic values can be observed in table 6.
Table 6. Significance of differences between loss curves of regions in Argentina.
|
|
Dominated
|
|
|
|
Centro
|
Cuyo
|
Buenos Aires City
|
NEA
|
NOA
|
Patagonia
|
|
Dominates
|
Centro
|
---
|
0.000
|
0.000
|
0.000
|
0.000
|
0.000
|
|
Cuyo
|
2.111***
|
---
|
INC
|
0.000
|
INC
|
INC
|
|
Buenos Aires City
|
3.891***
|
INC
|
---
|
0.000
|
2.588***
|
1.123*
|
|
NEA
|
4.256***
|
2.602***
|
1.462**
|
---
|
3.314***
|
2.263***
|
|
NOA
|
1.831***
|
INC
|
0.000
|
0.000
|
---
|
0.000
|
|
Patagonia
|
3.239***
|
INC
|
0.000
|
0.000
|
1.641***
|
---
|
Source: Own elaboration based on DesInventar (2018).
Notes: INC is Inconclusive (there is no first order stochastic dominance). * significant at 10%, significant at 5%, significant at 1%.
It is observed that, in cases where there is a relationship of stochastic dominance (Table 5), the differences are significant -at 1%- except for the cases of Buenos Aires City-NEA (significant at 5%) and Patagonia- Buenos Aires City (significant at 10%). This implies that, the regions that first order stochastically dominate the others, not only have a greater exceedance probability -for any mortality level chosen for the comparison- but also these probabilities are significantly higher.
Considering all the above, it is clear that the Centro region has the highest mortality risk while the NEA region the lowest one. This seems to be counterintuitive given that northern provinces (those of NEA and NOA) have the highest incidence of poverty and child mortality and malnutrition rates. This is, northern provinces -and their populations- are more vulnerable to the occurrence of disasters and higher levels of vulnerability are associated with a higher mortality (CRED, 2019). In this regard, two considerations must be made.
First, exceedance probabilities, in this work, have not been normalized by population. This is, is not the same one death in the NEA region (with an approximate population of 4 million inhabitants) than one death in the Centro region (more than 20 million inhabitants). However, regions with similar populations -NEA, NOA, Cuyo and Patagonia- present wide differences in death toll. This work exploited this geographical variation in mortality.
Second, given the main database used, DesInventar, it is conceivable the presence of bias. This is because the database is constructed from newspaper reports and most of these newspapers are located in the Centro region. For this, it is not unjustified to think that DesInventar reflects more precisely disasters that take place in this region but to a lesser extent those disasters of peripheral regions (as NEA or NOA). Some caveats related to the use of newspaper information in the analysis of disasters can be consulted in Natenzon (2003).
On the other hand, it should be emphasized -despite the objective of this work- that mortality is not the only aspect that matters after the occurrence of a natural disaster. In this sense, disasters may also affect the formation of human capital. On the one hand, they can destroy educational and health centres or the transport infrastructure of affected areas. On the other hand, if they affect household income, the demand for human capital may be reduced given the lower disposable income and increased marginal utility of labour (Ferreira & Schady, 2008). In extreme cases, natural disasters can affect nutrition. This, in turn, may generate long-lasting negative effects (persistence).
The persistence of the effects of disasters has been evaluated on broad topics such as health (Maclean et al., 2016; Hikichi, Aida, Kondo & Kawachi, 2019; Ogasawara, 2019), education (Caruso, 2017), income (Mueller & Osgood, 2009), poverty (Shahabuddin & Ali, 2006) or risk aversion (Cassar, Healy & Von Kessler, 2017). For the case of Argentina, González et al. (2020) find -considering a differences-in-differences specification- that early exposure (during the first year of life) to natural disasters has a negative and significant effect on educational achievement of adults. Controlling by district and birth cohort and other individual attributes, people exposed to natural disasters -during their first year of life- have 0.03 less years of education than unexposed people. Exposure also increases the chances of being unemployed (OR = 1.02) and is associated with an increase in the chances of being multidimensionally poor in adulthood (OR = 1.05).
All of the above is in line with an idea that has broad consensus: natural disasters are a really complex socio-economic phenomenon. In addition to mortality directly attributable to the disaster, other diseases can contribute to increasing the number of post-disaster deaths. In turn, even without considering this, disasters impose series interruptions to the functioning of the affected communities due to the destruction of their essential infrastructure and the potential long-lasting effects on the affected people.
5. CONCLUSIONS
Throughout this work I have tried to quantify -in probabilistic terms- the risk of mortality from natural disasters in regions of Argentina, using historical records of the DesInventar series for the 1970-2015 period. Using an information diffusion method -initially applied in this subject by Huang (1997)- results were found concordant with the idea that the Centro region is the one that presents the highest exceedance probabilities for any level of mortality. In turn, the Noreste region (NEA) appears with the lowest exceedance probability.
Robust comparisons -between pairs of regions- were made based on first order stochastic dominance criterion considering loss curves (complementary cumulative distribution functions). In turn, the significance of the differences was evaluated from the test proposed by Barret and Donald (2003) from which it was detected that, with the exception of the pairs of Buenos Aires City-NEA and Patagonia-Buenos Aires City, the differences are significant at 1% in all cases where there is a relationship of first order stochastic dominance.
This work provided novel estimates of mortality risk for the Argentine case. This was the main contribution in the analysis of natural disasters. However, further research is needed. In particular, the presence of geographical bias in DesInventar records must be examine. This is, given that the records in this database are built from what is reported by the main newspapers in the country, it is reasonable to think that the disasters that take place in the Centro region will be better recorded than those that take place in peripheral regions
In synthesis, the results of this research attempted to contribute to the mitigation of disaster risk, especially considering the regional disparities in Argentina. In the future, to fully achieve the above, the availability of detailed and updated records of natural disasters occurring in Argentine territory is of utmost importance. Therefore, active government actions are strongly recommended in the generation and provision of data on natural disasters. It is desirable to incorporate information from multiple agencies -public and private-, contributing in this way to a better understanding of the phenomenon and its consequences and avoiding the potential presence of bias.
ACKNOWLEDGMENTS
I thank the anonymous reviewers and Francisca Ruiz Rodríguez for their careful reading of my manuscript and their many insightful comments and suggestions.
REFERENCES
Alderman, K., Turner, L. &Tong, S. (2012). Floods and human health: A systematic review. Environment International, 47, 37-47. https://doi.org/10.1016/j.envint.2012.06.003
Alkire, S., Foster, J., Seth, S., Santos, M., Roche, J. & Ballon, P. (2015). Multidimensional poverty measurement and analysis. Oxford: Oxford University Press. https://doi.org/10.1093/acprof:oso/9780199689491.001.0001
Alkire, S. & Santos, M. (2014). Measuring Acute Poverty in the Developing World: Robustness and Scope of the Multidimensional Poverty Index. World Development, 59, 251-274. https://doi.org/10.1016/j.worlddev.2014.01.026
Askan, A. & Yucemen, M. (2010). Probabilistic methods for the estimation of potential seismic damage: Application to reinforced concrete buildings in Turkey. Structural Safety, 32(4), 262-271. https://doi.org/10.1016/j.strusafe.2010.04.001
Bai, C., Zhang, R., Hong, M., Qian, L. & Wang, Z. (2014). A new information diffusion modelling technique based on vibrating string equation and its application in natural disaster risk assessment. International Journal of General System, 44(5), 601-614. https://doi.org/10.1080/03081079.2014.980242
Balezentis, T., Streimikiene, D., Melnikiene, R. & Yu, Z. (2017). Non-parametric analysis of yield risk in Lithuanian crop farming. Journal of Business Economics and Management, 18(3), 521-536. https://doi.org/10.3846/16111699.2017.1322633
Banholzer, S., Kossin, J. & Donner, S. (2014). The impact of climate change on natural disasters. In Zommers, Z. & Singh, A. (Ed) Reducing disasters: Early Warning systems for climate change. Netherlands: Springer. https://doi.org/10.1007/978-94-017-8598-3_2
Barrenechea, J., Gentile, E., González, S. & Natenzon, C. (2000). Una propuesta metodológica para el estudio de la vulnerabilidad social en el marco de la teoría social del riesgo. Work presented in the IV Jornadas de Sociología, Buenos Aires in November of 2000.
Barret, G. & Donald, S. (2003). Consistent Tests For Stochastic Dominance. Econometrica, 71(1), 71-104. https://doi.org/10.1111/1468-0262.00390
Barros, V., Menéndez, A., Natenzon, C., Kohot, R., Condignotto, J. et al. (2006). Vulnerability to floods in the metropolitan region of Buenos Aires under future climate change. Working paper 26, AIACC.
Bolzan, A., Mercer, R., Ruiz, V., Brawerman, J., Marx, J., Adrogué, G., Carioli, N. & Cordero, C. (2005). Evaluación nutricional antropométrica de la niñez pobre del norte argentino: Proyecto encuNa. Archivos Argentinos de Pediatría, 103(6), 545-555.
Brecht, H., Deichmann, U. & Gun Wang, H. (2013). A global urban risk index. Policy research working paper 6506, World Bank. https://doi.org/10.1596/1813-9450-6506
Caruso, G. (2017). The legacy of natural disasters: The intergenerational impact of 100 years of disasters in Latin America. Journal of Development Economics, 127, 209-233. https://doi.org/10.1016/j.jdeveco.2017.03.007
Casco, S., Natenzon, C., Basterra, N. & Neiff, J. (2011). Inundaciones en el Bajo Paraná ¿Se puede articular la gestión social a partir del comportamiento hidrológico previo? Interciencia, 36(6), 423-430.
Cassar, A., Healy, A. & Von Kessler C. (2017). Trust, risk and time preferences after a natural disaster: experimental evidence from Thailand. World Development, 94, 90-105. https://doi.org/10.1016/j.worlddev.2016.12.042
CNPHV (2010). Censo Nacional de Población, Hogares y Viviendas 2010. Retrieved from https://www.indec.gov.ar/nivel4_default.asp?id_tema_1=2&id_tema_2=41&id_tema_3=135
Cortés Conde, R. (1998). La economía de exportación de Argentina, 1880-1920. Anuario del Instituto de Estudios Históricos y Sociales 3, Facultad de Ciencias Humanas-Universidad Nacional del Centro.
CRED (2009). Disaster Category Classification and peril Terminology for Operational Purposes. Working paper 264, CRED.
CRED (2015). The human cost of natural disasters 2015. Report of Centre for Research on the Epidemiology of Disasters.
CRED (2019). Natural disasters 2018. Report of the Centre for Research on the Epidemiology of Disasters. Retrieved from https://www.emdat.be/publications
CRED (2020). Disaster Year in Review 2019. CRED Crunch 58.
DesInventar (2018). Disasters database. Retrieved from https://www.desinventar.org/es/
Díaz Orueta, F., González Villar, C., Lourés, M. & Sintes, L. (2000). Desarrollo urbano y pobreza: La ciudad de Posadas, Argentina. Alicante: Universidad de Alicante.
Ferreira, F. & Schady, N. (2008). Aggregate economics shocks, child schooling and child health. Working paper series 4701, World Bank. https://doi.org/10.1596/1813-9450-4701
Frankenberg, E., Thomas, G., Samuel, P., Bondan, S. & Duncan, T. (2011). Mortality, the family and the Indian Ocean tsunami. Economic Journal, 121(554), 162-182. https://doi.org/10.1111/j.1468-0297.2011.02446.x
Fujiwara, T., Yagi, J., Homma, H., Mashiko, H., Nagao, K. & Okuyama, M. (2017). Suicide risk among young children after the Great East Japan Earthquake: A follow-up study. Psychiatry Research, 253, 318-324. https://doi.org/10.1016/j.psychres.2017.04.018
German Watch (2019). Global climate risk index 2019. Berlin: German Watch e.V.
González, F. (2019). Pobreza multidimensional urbana en Argentina: ¿Reducción de las disparidades entre el Norte Grande Argentino y Centro-Cuyo-Sur? (2003-2016). Master’s Thesis in Economics, Universidad Nacional del Sur.
González, F. (2020). Regional price dynamics in Argentina (2016-2019). Regional Statistics, in press.
González, F., Santos, M. & London, S. (2020). Persistent effects of natural disasters on human development: quasi-experimental evidence for Argentina. Environment, Development and Sustainability, in press.
Gorenstein, S., Castagna, A., Schorr, M., Napal, M., Raposo, I., Woelfin, M., Báscolo, P. & Ferreira, E. (2012). ¿Crecimiento o Desarrollo? El ciclo reciente en el norte argentino. Buenos Aires: Miño y Dávila editores.
Gronlund, C., Sullivan, K., Kefelegn, Y., Cameron, L. & O´neill, M. (2018). Climate change and temperature extremes: A review of heat- and coldrelated morbidity and mortality concerns of municipalities. Maturitas, 114, 54-59. https://doi.org/10.1016/j.maturitas.2018.06.002
Grunthal, G., Thieken, A., Schwarz, J., Radtke, K., Smolka, A. & Merz, B. (2006). Comparative risk assessment for the city of cologne-storms, floods, earthquake. Natural Hazards, 38(1-2), 21-44. https://doi.org/10.1007/s11069-005-8598-0
Hallegatte, S., Vogt-Schilb, A., Rozenberg, J., Bangalore, M. & Beaudet, C. (2020). From Poverty to Disaster and Back: a Review of the Literature. Economics of Disasters and Climate Change, 4, 223-247. https://doi.org/10.1007/s41885-020-00060-5
Heidenreich, N., Schindler, A. & Sperlich, S. (2013). Bandwidth selection for kernel density estimation: a review of fully automatic selectors. AstA Advances in Statistical Analysis, 97(4), 403-433. https://doi.org/10.1007/s10182-013-0216-y
Herrero, A., Natenzon, C. & Miño, M. (2018). Vulnerabilidad social, amenazas y riesgos frente al cambio climático en el Aglomerado Gran Buenos Aires. Working paper 172, CIPPEC.
Hikichi, H., Aida, J., Kondo, K, & Kawachi, I. (2019). Persistent impact of housing loss on cognitive decline after the 2011 Great East Japan earthquake and tsunami: evidence from a 6-year longitudinal study. Alzheimer´s & Dementia, 15, 1009-1018. https://doi.org/10.1016/j.jalz.2019.04.016
Ho, J., Frankenberg, E., Sumantri, C. & Thomas, D. (2017). Adult mortality five years after a natural disaster: Evidence from the Indican ocean tsunami. Working paper 22317, NBER. https://doi.org/10.3386/w22317
Hu, P., Zhang, Q., Shi, P., Chen, B. & Fang, J. (2018). Flood-induced mortality across the globe: Spatiotemporal pattern and influencing factors. Science of the Total Environment, 643, 171-182. https://doi.org/10.1016/j.scitotenv.2018.06.197
Huang, C. (1997). Principle of information diffusion. Fuzzy sets and systems, 91, 69-90. https://doi.org/10.1016/S0165-0114(96)00257-6
INDEC (2003). ¿Qué es el Gran Buenos Aires? Buenos Aires: INDEC. Retrieved from https://www.indec.gov.ar/nuevaweb/cuadros/4/folleto%20gba.pdf
INDEC (2004). Serie Producto Interno Bruto por Provincia. Retrieved from https://www.indec.gob.ar/nivel4_default.asp?id_tema_1=3&id_tema_2=9&id_tema_3=138
INDEC (2018). Origen provincial de las exportaciones año 2017. Informe Técnico de Comercio Exterior, 2(5).
INDEC (2019). Diseño de registro y estructura para las bases preliminares Hogar y Personas, Encuesta Permanente de Hogares. Retrieved from https://www.indec.gob.ar/bases-de-datos.asp
Inter-American Development Bank (2003). Information and indicators program for disaster risk management. Report ATN/JF-7907-RG.
IPCC (2018). Impacts of 1.5 ºC Global Warming on Natural and Human Systems en Global Warming of 1.5°C. Special Report of IPCC. Retrieved from https://www.ipcc.ch/site/assets/uploads/sites/2/2019/05/SR15_Chapter3_Low_Res.pdf
Kousky, C. (2012). Informing Climate Adaptation: A Review of the Economic Costs of Natural Disasters, Their Determinants, and Risk Reduction Options. Disussion paper, 12-28, Resources for the Future. https://doi.org/10.2139/ssrn.2099769
Liu, B., Siu, Y. & Mitchell, G. (2016). The danger of mapping risk from multiple natural hazards. Natural Hazards, 82(1), 139-153. https://doi.org/10.1007/s11069-016-2184-5
Liu, B., Siu, Y. & Mitchell, G. (2017). A quantitative model for estimating risk from multiple interacting natural hazards: an application to northeast Zhejiang, China. Stochastic Environmental Research and Risk Assessment, 31, 1319-1340. https://doi.org/10.1007/s00477-016-1250-6
Liu, B., Siu, Y., Mitchell, G. & Xu, W. (2013). Exceedance probability of multiple natural hazards: risk assessment in China´ Yangtze River Delta. Natural Hazards, 69, 2039-2055. https://doi.org/10.1007/s11069-013-0794-8
Longhi, F. & Osatinsky, A. (2017). Estructura productiva, pobreza y problemas de empleo en las provincias pampeanas y norteñas de Argentina en los primeros años del siglo XXI. Cuadernos de Geografía, 26(1), 77-99. https://doi.org/10.15446/rcdg.v26n1.51011
López, R., Thomas, V. & Troncoso, P. (2015). Climate change and natural disasters. Working paper series 414, Universidad de Chile.
Maclean, J., Popovici, I. & French, M. (2016). Are natural disasters in early childhood associated with mental health and substance use disorders as an adult? Social science & Medicine, 151, 78-91. https://doi.org/10.1016/j.socscimed.2016.01.006
Maldonado, G., Natenzon, C. & Cóccaro, J. (2005). Algunos aportes teóricos-metodológicos para el estudio de las inundaciones en el sur de la Provincia de Córdoba. Work presented in the VII Jornadas de Investigación en Geografía in La Plata 2005.
Matsubayashi, T., Sawada, Y. & Ueda, M. (2013). Natural disasters and suicide: Evidence from Japan. Social Science & Medicine, 82, 126-133. https://doi.org/10.1016/j.socscimed.2012.12.021
Ministerio de Producción y Trabajo de la Nación (2018). Boletín de Empleo registrado y privado por Provincia. Serie anual-año 2017. Reporte del Observatorio de Empleo y Dinámica Empresarial. Retrieved from http://www.trabajo.gob.ar/estadisticas/index.asp
Montroull, N., Saurral, R. & Camilloni, I. (2018). Hydrological impacts in La Plata basin under 1.5, 2 and 3 °C global warming above the pre-industrial level. International Journal of Climatology, 38(8), 3355-3368. https://doi.org/10.1002/joc.5505
Mueller, V. & Osgood, D. (2009). Long-term consequences of short-term precipitation shocks: evidence from Brazilian migrant households. Agricultural Economics, 40(5), 573-586. https://doi.org/10.1111/j.1574-0862.2009.00399.x
Munich Re (2019). Natural Catastrophe Service. Retrieved from https://natcatservice.munichre.com/overall/1
Natenzon, C. (2003). La información periodística y la investigación del riesgo ambiental. Espaço e Tempo, 14, 159-164. https://doi.org/10.11606/issn.2179-0892.geousp.2003.123844
Natenzon, C. (2016). Reflexiones sobre riesgo, vulnerabilidad social y prevención de desastres. Revista Ciéncia & Trópico, 40(1), 99-108.
Ogasawara, K. (2019). Persistence of natural disasters on child health: evidence from the Great Kanto earthquake of 1923. Cornell University arXiv. Retrieved from https://arxiv.org/abs/1805.08148
Olya, H. & Alipour, H. (2015). Risk assessment of precipitation and the tourism climate index. Tourism Management, 50, 73-80. https://doi.org/10.1016/j.tourman.2015.01.010
UNDP (2004). Reducing disaster risk: a challenge for development. New York: Bureau for crisis prevention and recovery.
Rios, D. (2014). Riesgo de desastres y urbanismo neoliberal: los cimientos de las transformaciones urbano-ambientales contemporáneas en Tigre/Buenos Aires. HALAC, 4(1), 57-86. https://doi.org/10.11606/issn.2179-0892.geousp.2011.74199
Ríos, D. & González, S. (2011). Una aproximación a las relaciones entre espacio urbano y riesgo de desastres. Dos casos de estudio para el centro y la periferia del Aglomerado Gran Buenos Aires. Espaço e Tempo, 29, 184-198.
Santos, M. & Zaratiegui, E. (2017). Pobreza en Argentina y Bahía Blanca desde un enfoque de dominio estocástico, período 2004-2016. Work presented in the LII Annual Meeting of the Argentine Association of Political Economy, San Carlos de Bariloche in november of 2017.
Shahabuddin, Q. & Ali, Z. (2006). Natural disasters, risks, vulnerability and persistence of poverty: an analysis of household level data. Working paper 15, Programme for Research on Chronic Poverty in Bangladesh. https://www.gov.uk/dfid-research-outputs/natural-disasters-risks-vulnerability-and-persistence-of-poverty-an-analysis-of-household-level-data-prcpb-working-paper-no-15
Stephenson, D., Hunter, A., Youngman, B. & Cook, I. (2018). Towards a More Dynamical Paradigm for Natural Catastrophe Risk Modeling en Michel, G. Risk Modeling for Hazards and Disasters. Amsterdam: Elsevier. https://doi.org/10.1016/B978-0-12-804071-3.00003-3
UNISDR (2009). UNISDR terminology on disaster risk reduction. Geneva: UNISDR.
Viand, J. & Briones, F. (2015). Riesgos al Sur. Diversidad de riesgos de desastres en Argentina. Buenos Aires: Imago Mundi.
Winter, B., Schneeberger, K., Huttenlau, M. & Stotter, J. (2017). Sources of uncertainty in a probabilistic flood risk model. Natural Hazards, 91, 431-446. https://doi.org/10.1007/s11069-017-3135-5
World Bank (2005). Natural disaster hotspots: a global risk analysis. Disaster risk managment series 5. Washington: World Bank and Columbia University.
Xu, W., Ming, X., Ma, Y., Zhang, X., Shi, P., Zhuo, L. & Lu, B. (2019). Quantitative Multi-Hazard Risk Assessment of Crop Loss in the Yangtze River Delta Region of China. Sustainability, 11(922), 1-16. https://doi.org/10.3390/su11030922
Xu, W., Zhuo, L., Zheng, J., Gu, Z. & Tian, Y. (2016). Assessment of the Casualty Risk of Multiple Meteorological Hazards in China. International journal of environmental research and public health, 13(2), 1-12. https://doi.org/10.3390/ijerph13020222
Yang, S., Hu, F. & Jaeger, C. (2016). Impact Factors and Risk Analysis of Tropical Cyclones on a Highway Network. Risk Analysis, 36(2), 262-277. https://doi.org/10.1111/risa.12463